Analyse Impulse Response

Analysis · AnalyseIR
Analyse an impulse response (IR): acoustic parameters such as EDT, T20 and C50, and its time and frequency responses for Plot 2D. Computed in the compas_acoustics worker.
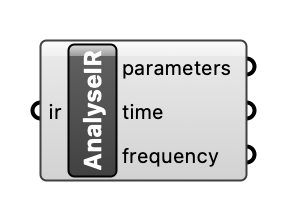
Inputs
| Name | Type | Access | Default | Description |
|---|---|---|---|---|
ir |
ghdoc | item | ImpulseResponse (IR) object. |
Outputs
| Name | Description |
|---|---|
parameters |
List of acoustic parameters: 'EDT', 'T20', 'T30', 'C50', 'C80', 'D50', 'DRR', 'Ts', 'STI' (with its modulation transfer index per band), 'G', 'SPL', 'LF' and 'LFC'. G and SPL (the sound pressure level from the source's level at 1 m, overall A-weighted) only for a simulated response; LF and LFC, the early lateral energy fractions, only for an ambisonic one. |
time |
The impulse response against time, for Plot 2D or a panel: the W channel of an ambisonic response, both ears (left, right) of a binaural one. Right-click the output to choose the scale: dB (default), the level re the peak, floored 100 dB below it, over the whole response; or linear, the amplitude, ending 5 % after the Schroeder curve has fallen 60 dB, below which the amplitude is not visible. The parameters and the frequency output use the whole response. |
frequency |
The frequency response, 1/3-octave smoothed, 20 Hz to 20 kHz in dB re the peak, for Plot 2D or a panel: the W channel of an ambisonic response, both ears (left, right) of a binaural one. |