Plot 2D

Display · Plot2D
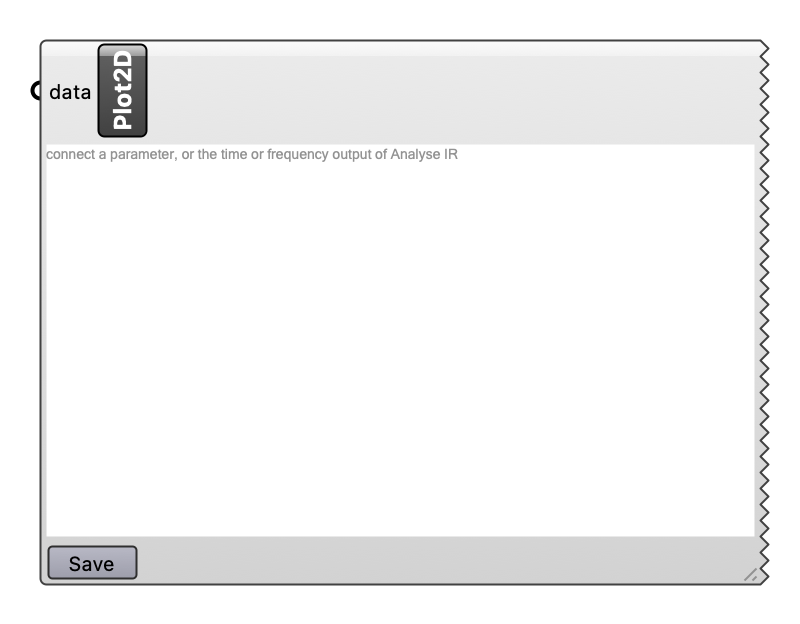
Chart an acoustic parameter (a dot per band, joined by a line), or the time or frequency response of Analyse Impulse Response (a line per channel), on the canvas: one chart per parameter connected, stacked. Drag the corner to resize; hover a chart to read its values; Save writes the charts as a PNG image.
Inputs
| Name | Type | Access | Default | Description |
|---|---|---|---|---|
data |
ghdoc | list | Data to chart: acoustic parameters (a dot per band, joined by a line), or the time or frequency output of Analyse Impulse Response (a line per channel). One chart each. |
Outputs
None.