Visualise Energy Map

Display · EnergyMap
Colour a surface by the sound pressure level of the scene's sources: the surface is meshed into faces no larger than spacing, one point per face centre, and each point gets the direct sound, the first-order image sources and pyroomacoustics' rays past them, with each source's level at 1 m (Source spl). The rays per source scale with the room's volume and the response length, for about 16000 hits per point (20000 to 250000 rays), with a fixed seed: the same scene gives the same map. Blue is the lowest level, red the highest; a face outside the room or inside an obstacle is grey. The Preview button shows or hides the drawing.
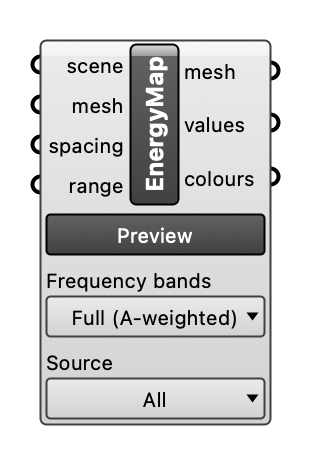
Inputs
| Name | Type | Access | Default | Description |
|---|---|---|---|---|
scene |
ghdoc | item | Room scene object. | |
mesh |
geometrybase | item | The analysis surface: a mesh, a surface or a Brep, for instance a plane at ear height. It is meshed into faces no larger than spacing, one point per face centre. | |
spacing |
float | item | 0.25 |
The largest edge of the map's faces, in metres: one point every spacing. The rays are traced on a 1 m grid whatever the spacing, so a finer map costs little more. Optional. |
source_idx |
int | item | Index of one source, in the order of the scene's sources. Empty (default): every source, their energies added. Optional. | |
frequency_bands |
int | item | One octave band, 0 (125 Hz) to 6 (8 kHz). Empty: the full level of all bands, A-weighted. Optional. | |
range |
interval | item | The levels in dB the colours run between. Empty (default): the lowest and highest level on the mesh. Optional. |
Outputs
| Name | Description |
|---|---|
mesh |
The mesh with each face in the colour of its level. |
values |
The level of each face in dB (dB(A) without a band); NaN outside the room. |
colours |
The colour of each face. |