Grasshopper Basics
- Introduction
- Interface
- Components
- Algorithms and Data
- Points, vectors and planes
- Lists
- Data Trees
- Surfaces
- Meshes
Introduction
Grasshopper is a visual programming editor developed by David Rutten at Robert McNeel & Associates.
Grasshopper and Rhino offer the opportunity to work with precise parametric control over models, allowing the exploration of generative design workflows.
Is a graphical algorithm editor that is integrated with Rhino modeling tools.
Algorithms are step by step procedures designed to perfom an operation.
You use Grasshopper to design algorithms that then automate tasks in Rhino
Why Grasshopper?
Visual programming
Plug & play components
Instant interactive preview
Easy learning curve
Lots of (free), cutting-edge add-ons
Vibrant community & forums
Program flow 
From left to right
Interface
UI
Grasshopper’s visual “plug-and-play” programming gives designers the ability to combine creative problem solving with novel rule systems through the use of a fluid graphical interface.
In Grasshopper you are able to create programs, called definitions by dragging components onto the main editing window (canvas).
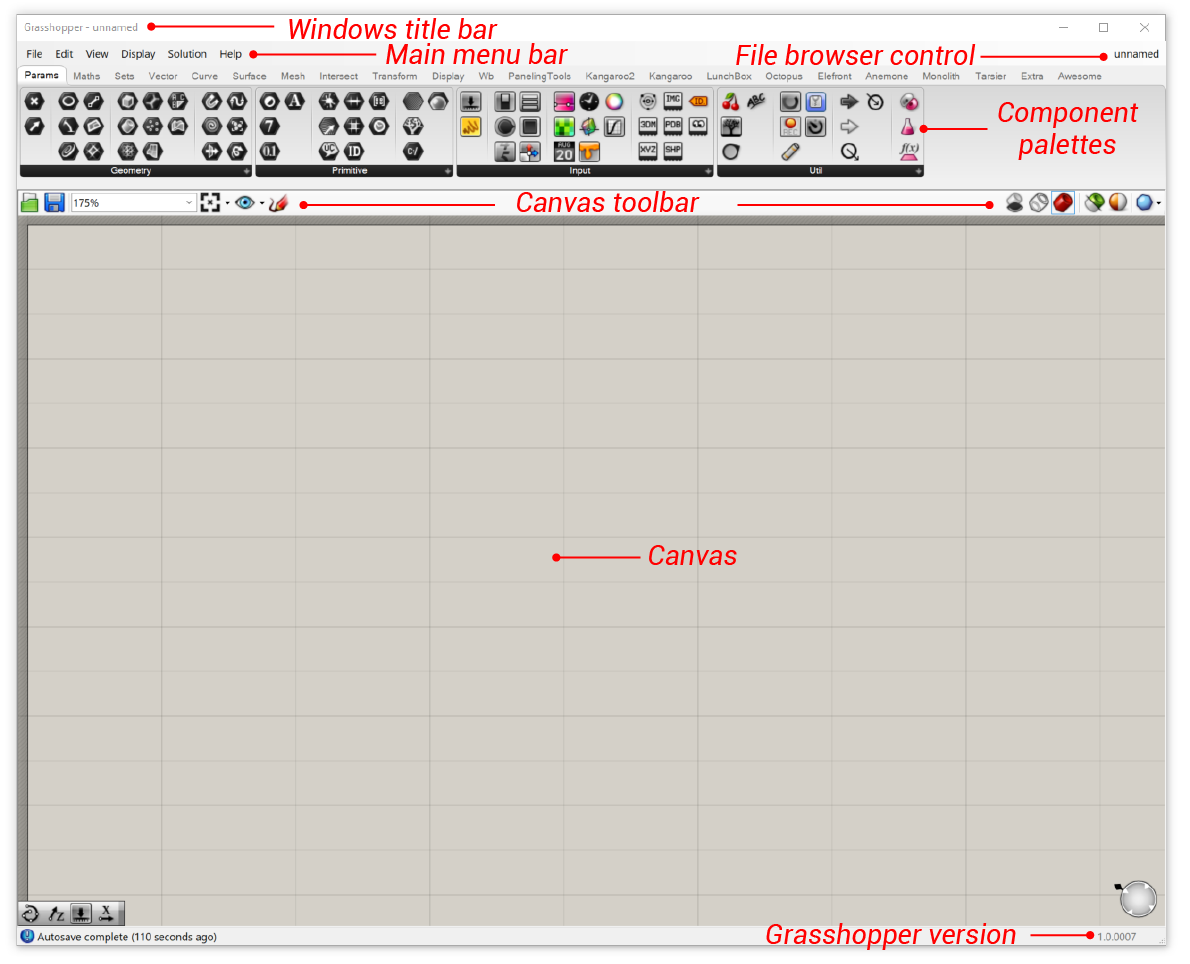
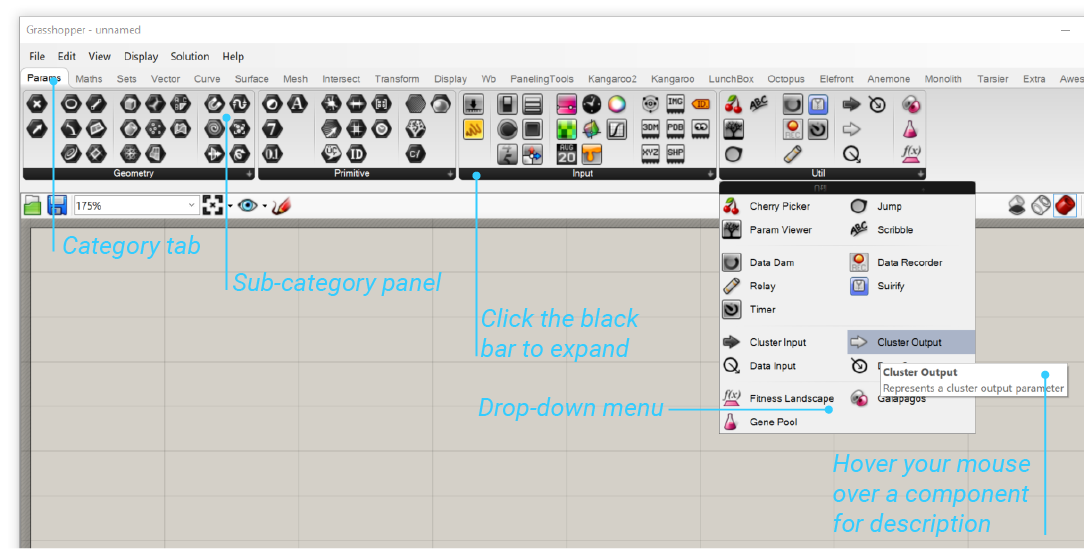
Component palettes
This area organizes components into categories and sub-categories. Categories are displayed as tabs, and subcategories are displayed as drop-down panels.
To add a component to the canvas, you can either click on the objects in the drop-down menu or you can drag the component directly from the menu onto the canvas.
To see a menu of all of the components in a given sub-category, simply click on the black bar at the bottom of each sub-category panel.
Canvas
The canvas is the primary workspace for creating Grasshopper definitions. It is here where you interact with the elements of your visual program. You can start working in the canvas by placing components and connecting wires.
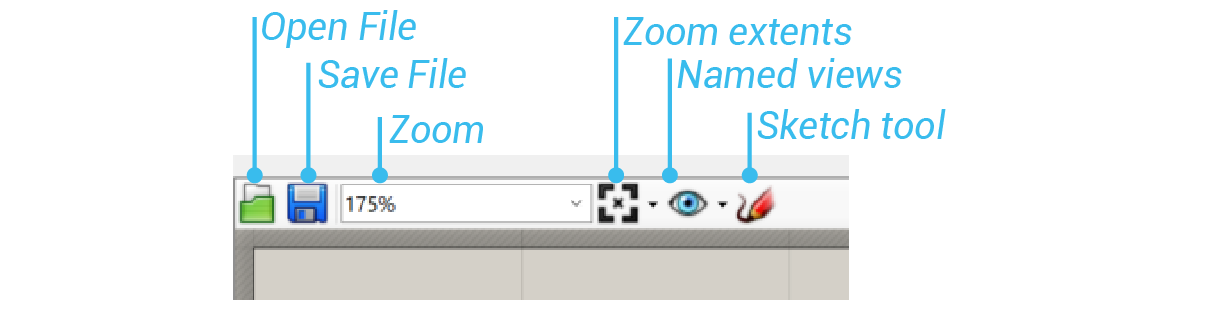
Toolbar
The canvas toolbar provides quick access to a number of frequently used Grasshopper features. All of the tools are available through the menu as well, and you can hide the toolbar as well.
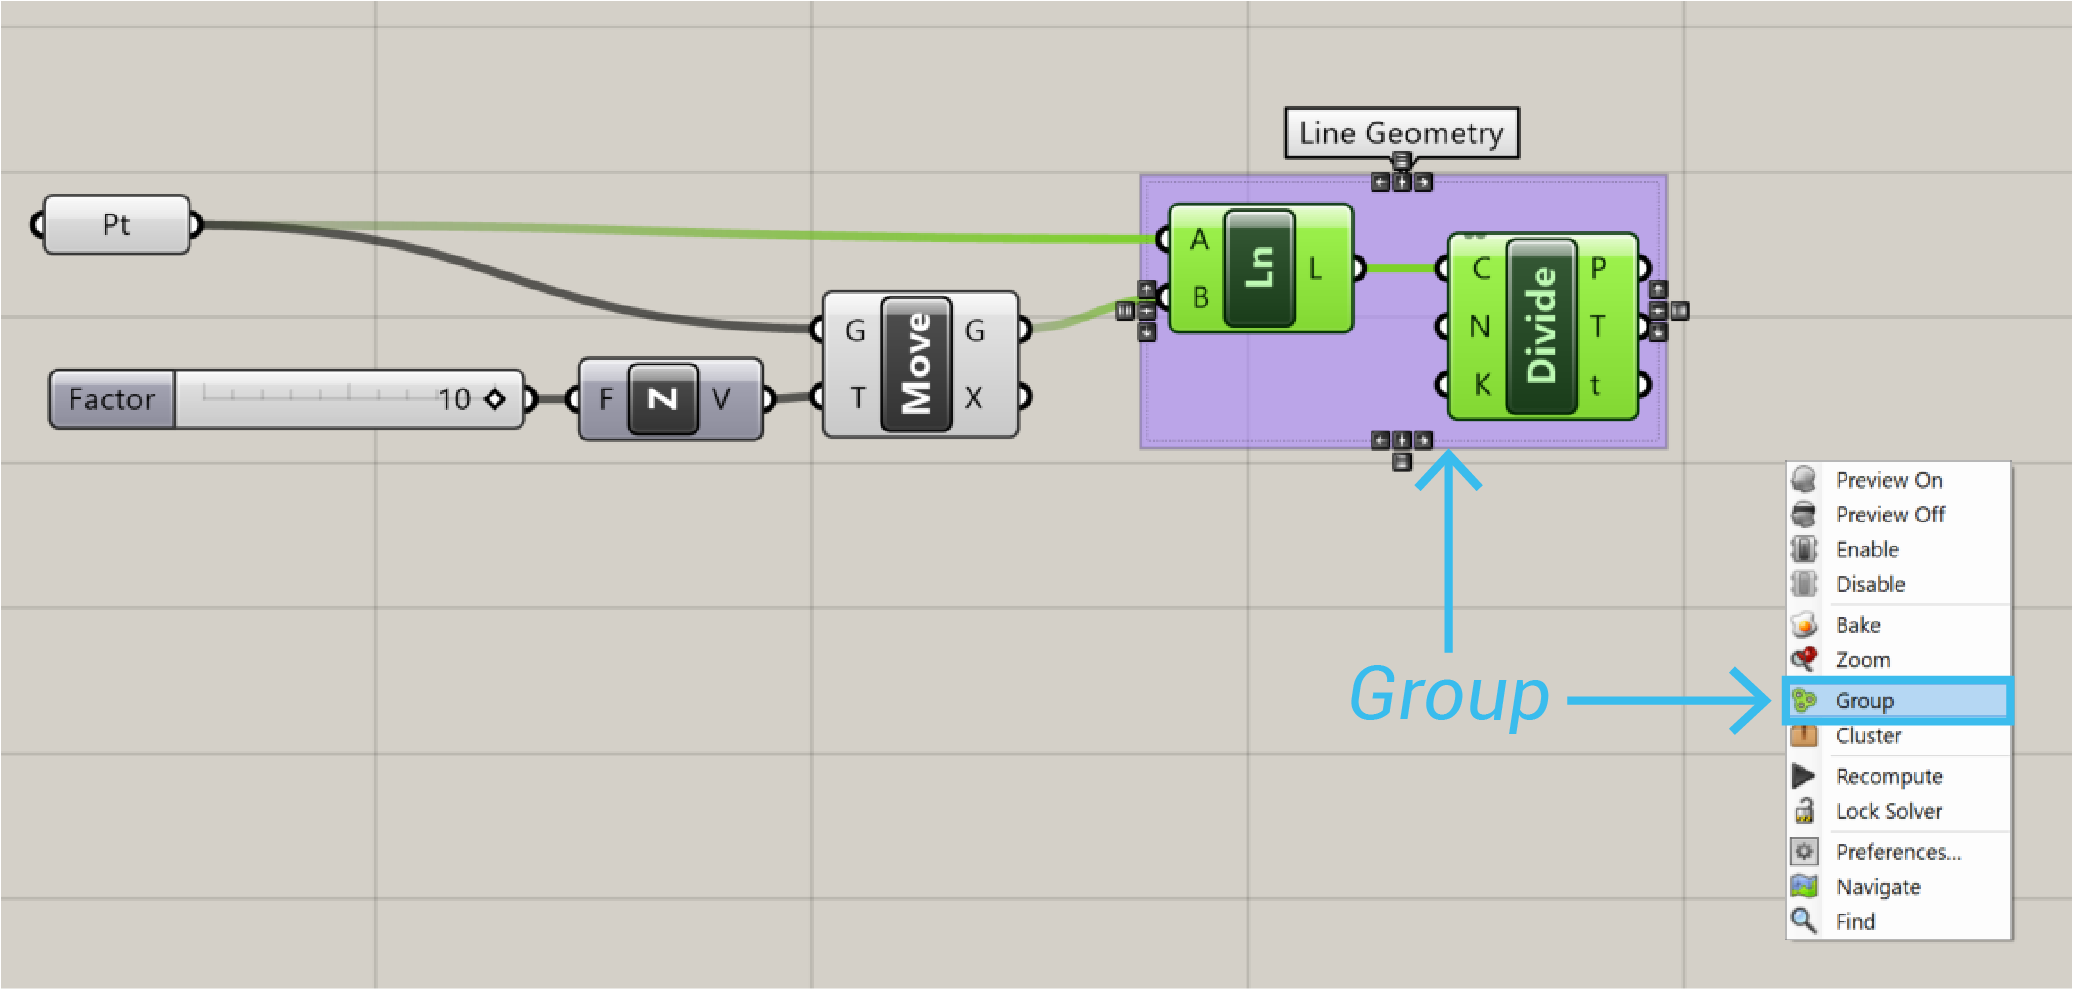
Grouping
Grouping components together on the canvas can be especially useful for readability and comprehensibility.
You can create a group by typing Ctrl+G with the desired components selected. An alternate method can be found by using the “Group Selection” button under the Edit Menu on the Main Menu Bar.
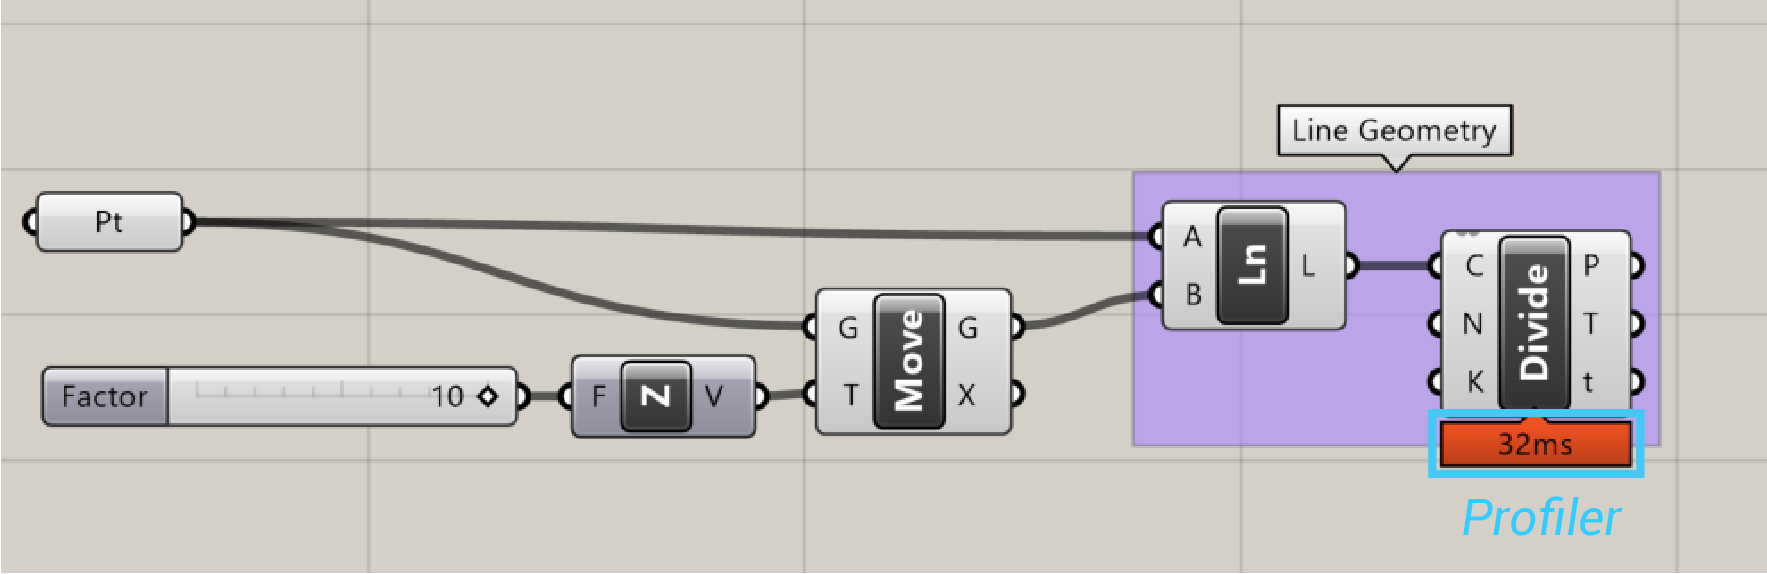
Profiler Widget
The profiler lists worst-case runtimes for parameters and components, allowing you to track performance.
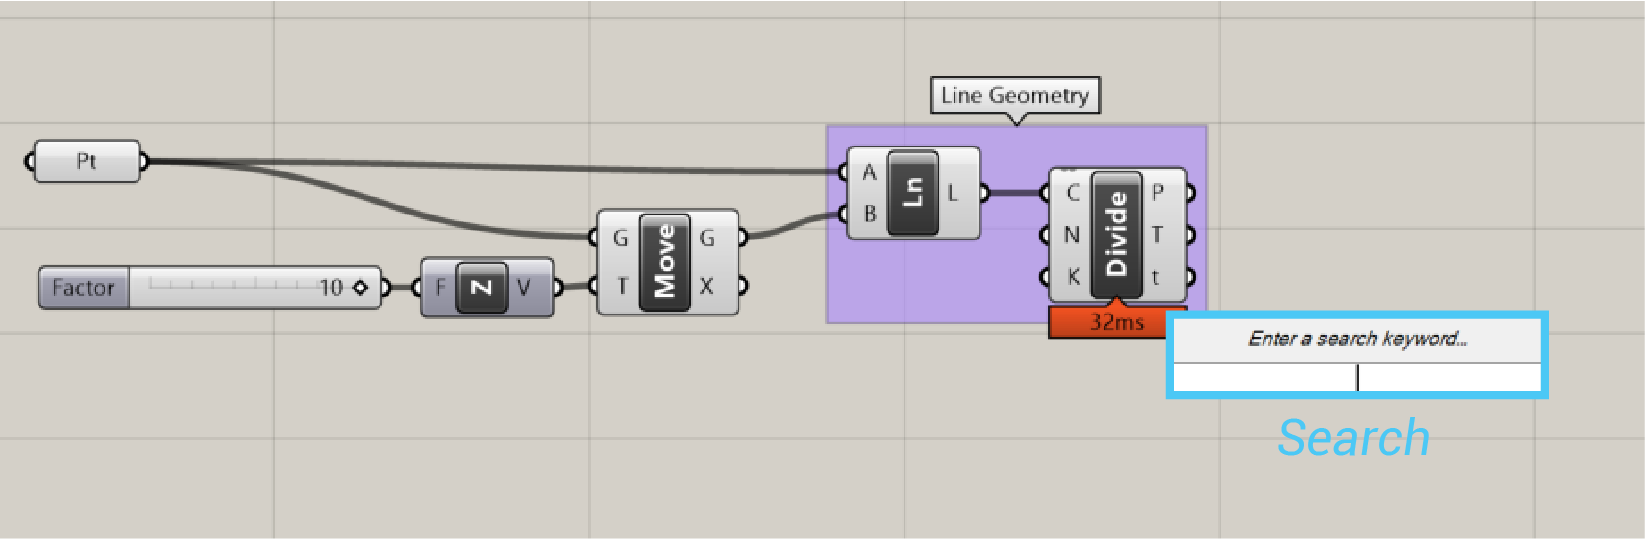
Search feature
You can find this component by double-clicking on any empty space on the canvas. This will open a pop-up search box. Simply type in the name of the component you are looking for and you will see a list of parameters or components that match your request.
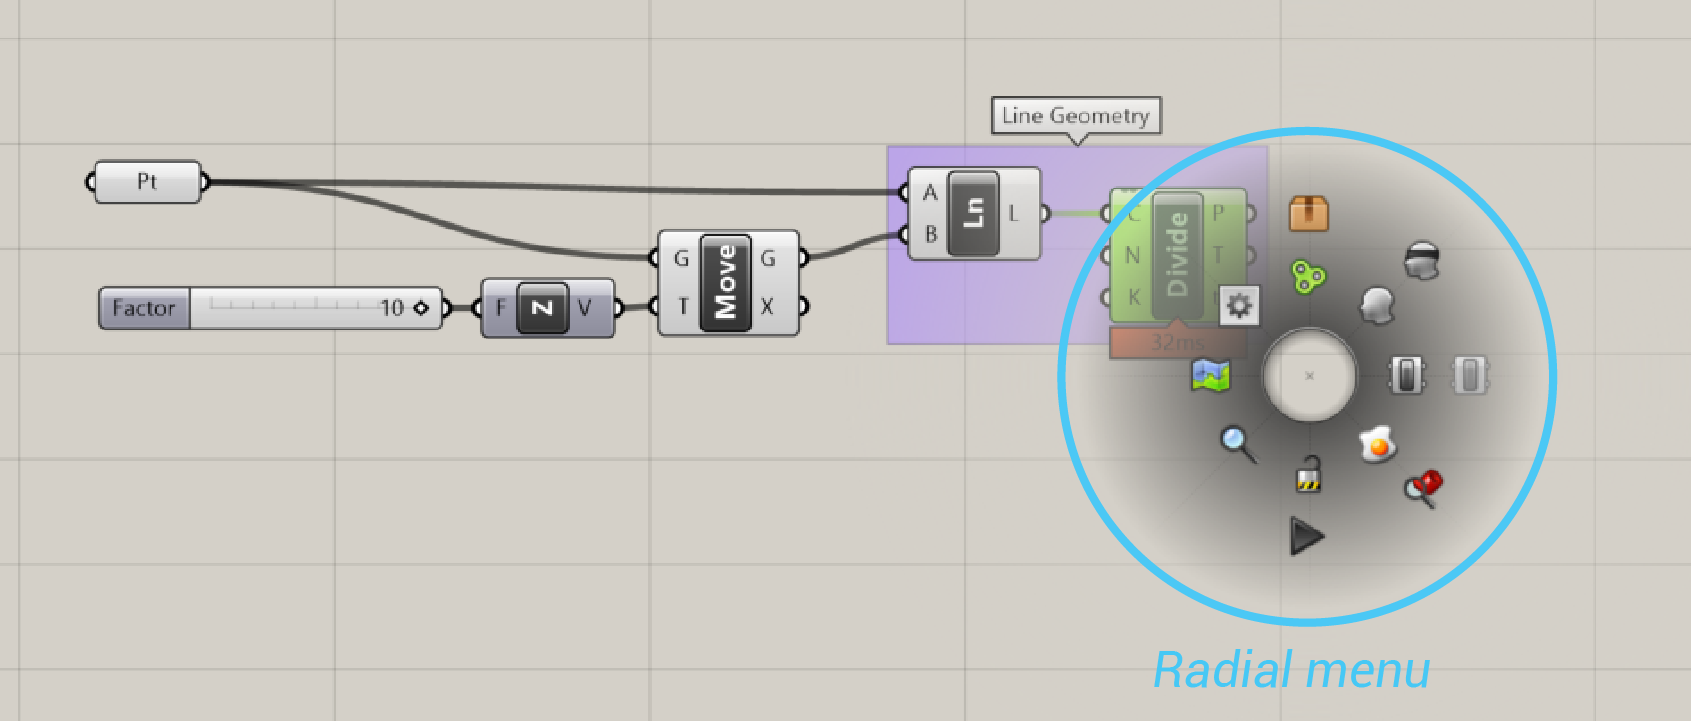
Radial Menu
You can open the radial menu by hitting the space bar (while your mouse is over the canvas or a component) or by clicking your middle mouse button. The radial menu has more features available when clicking on top of a selected component versus just clicking anywhere else on the canvas.
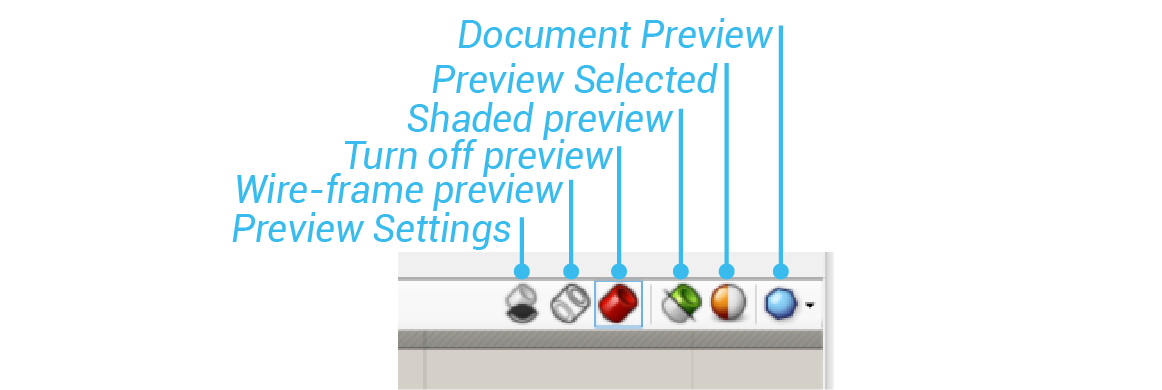
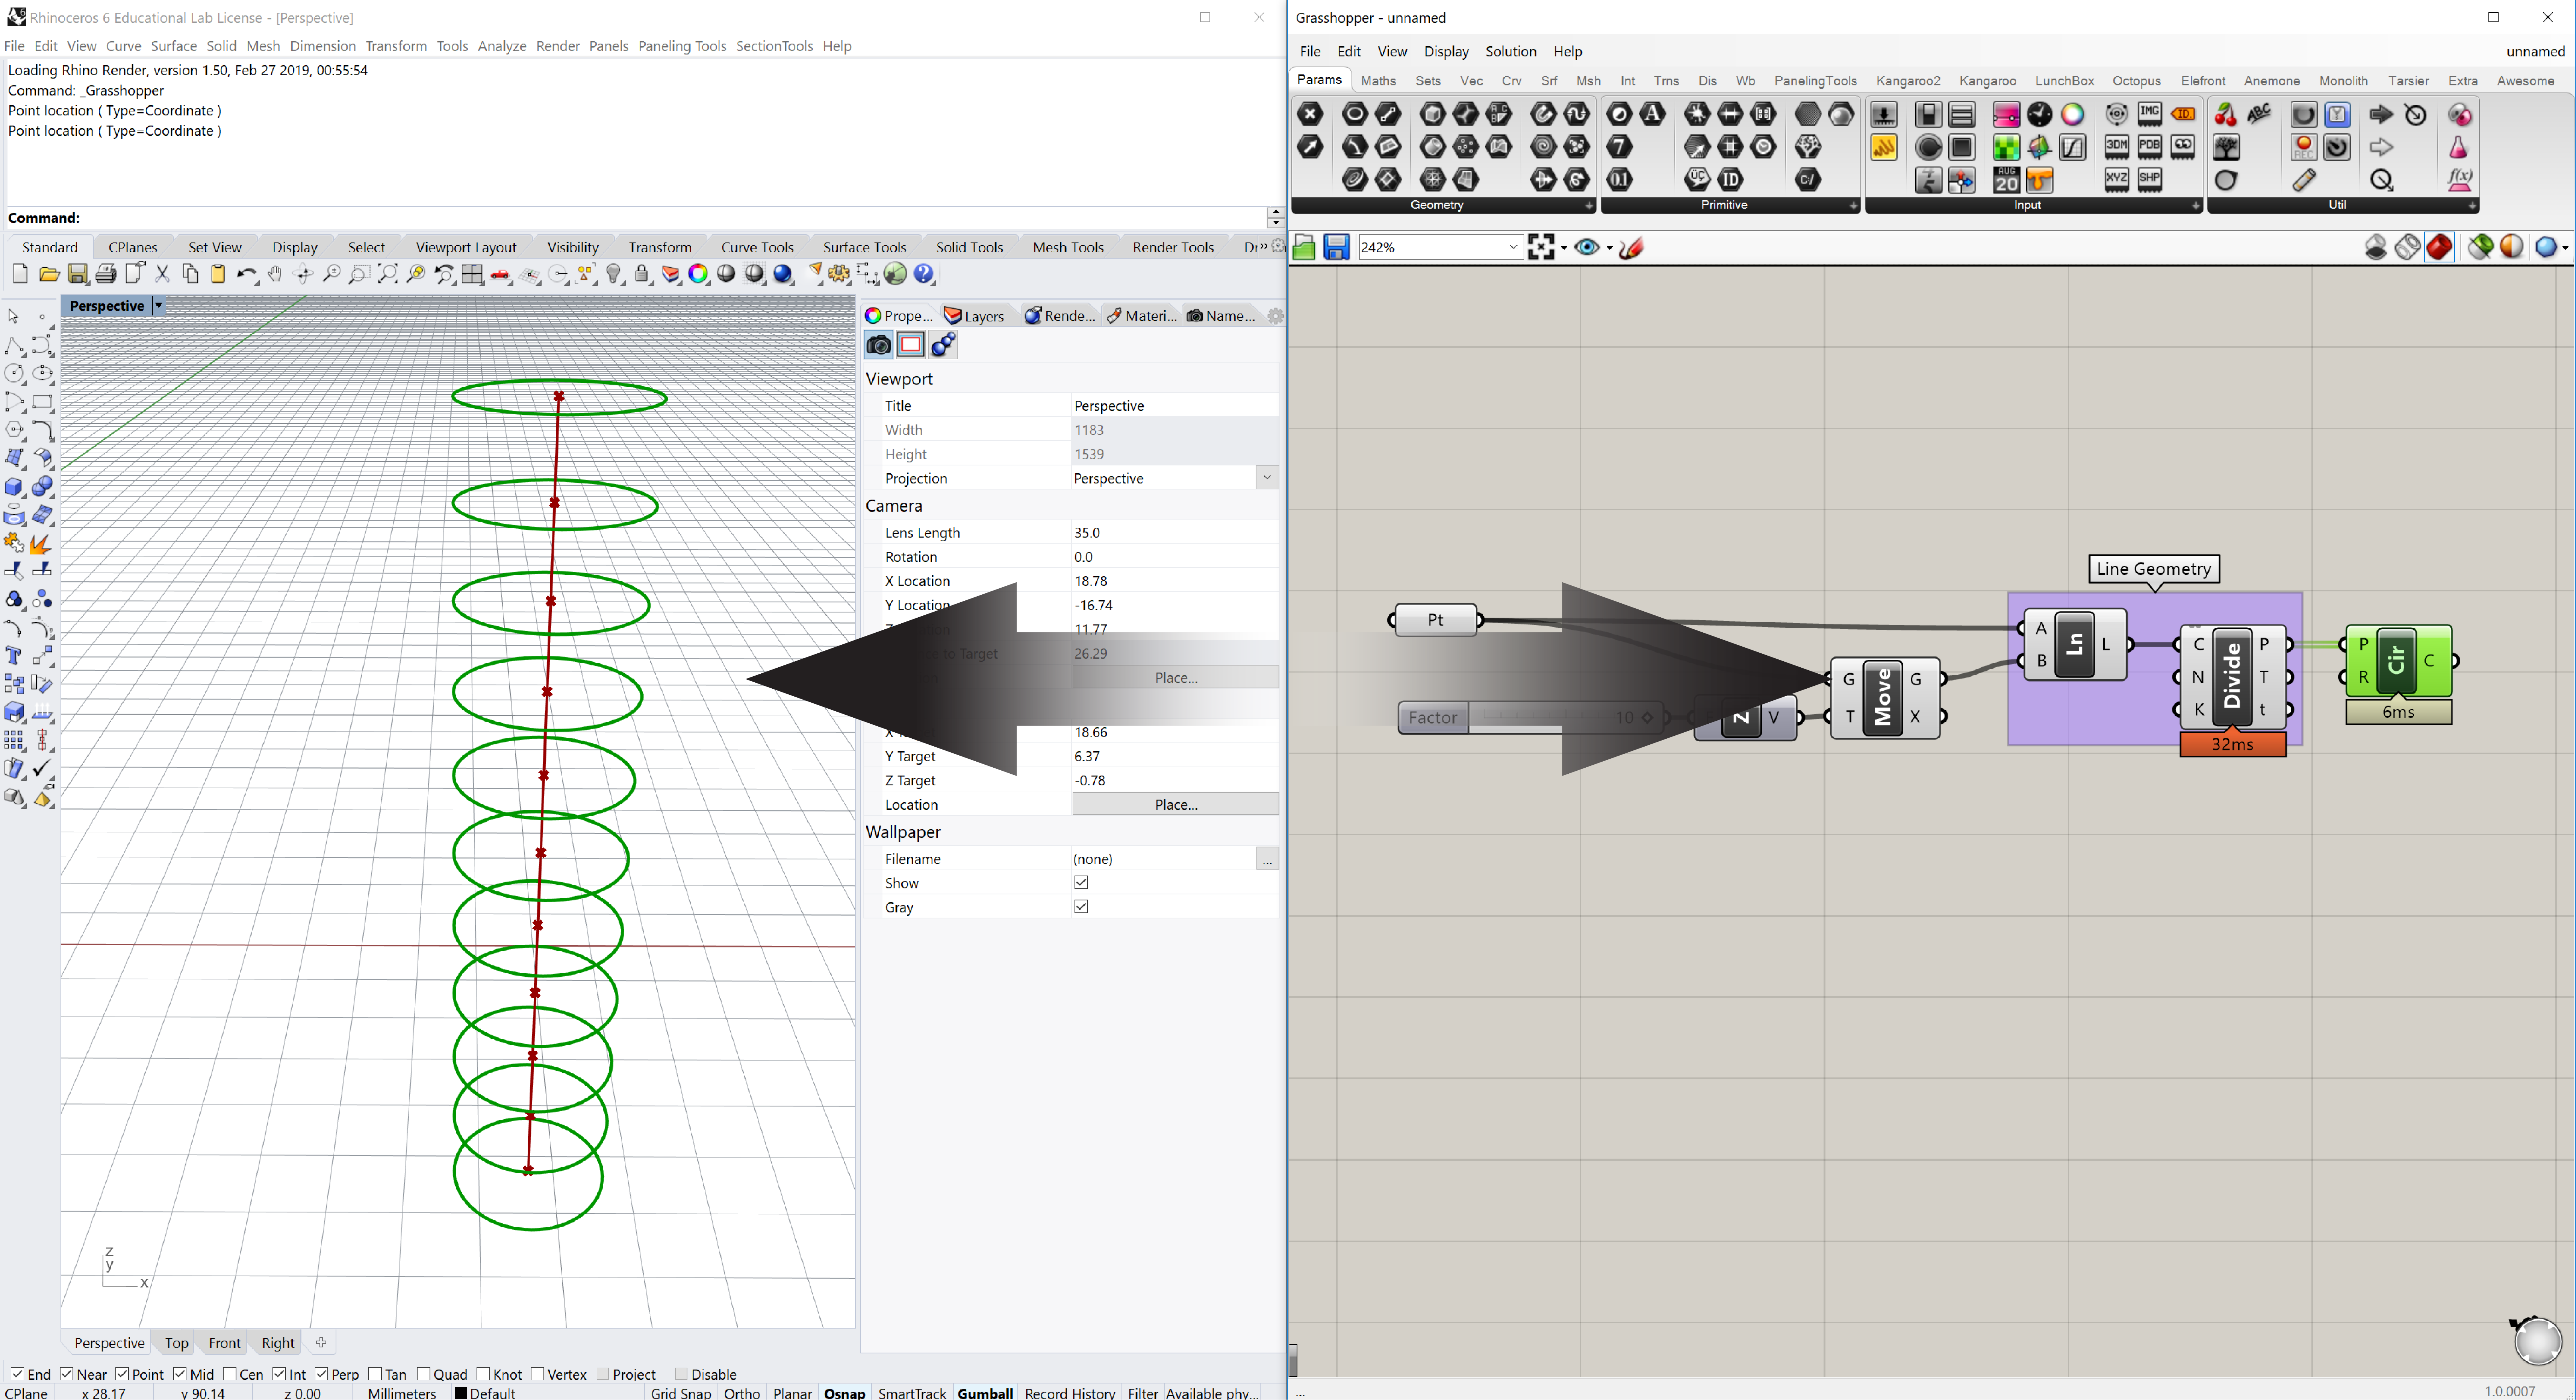
Rhino connection
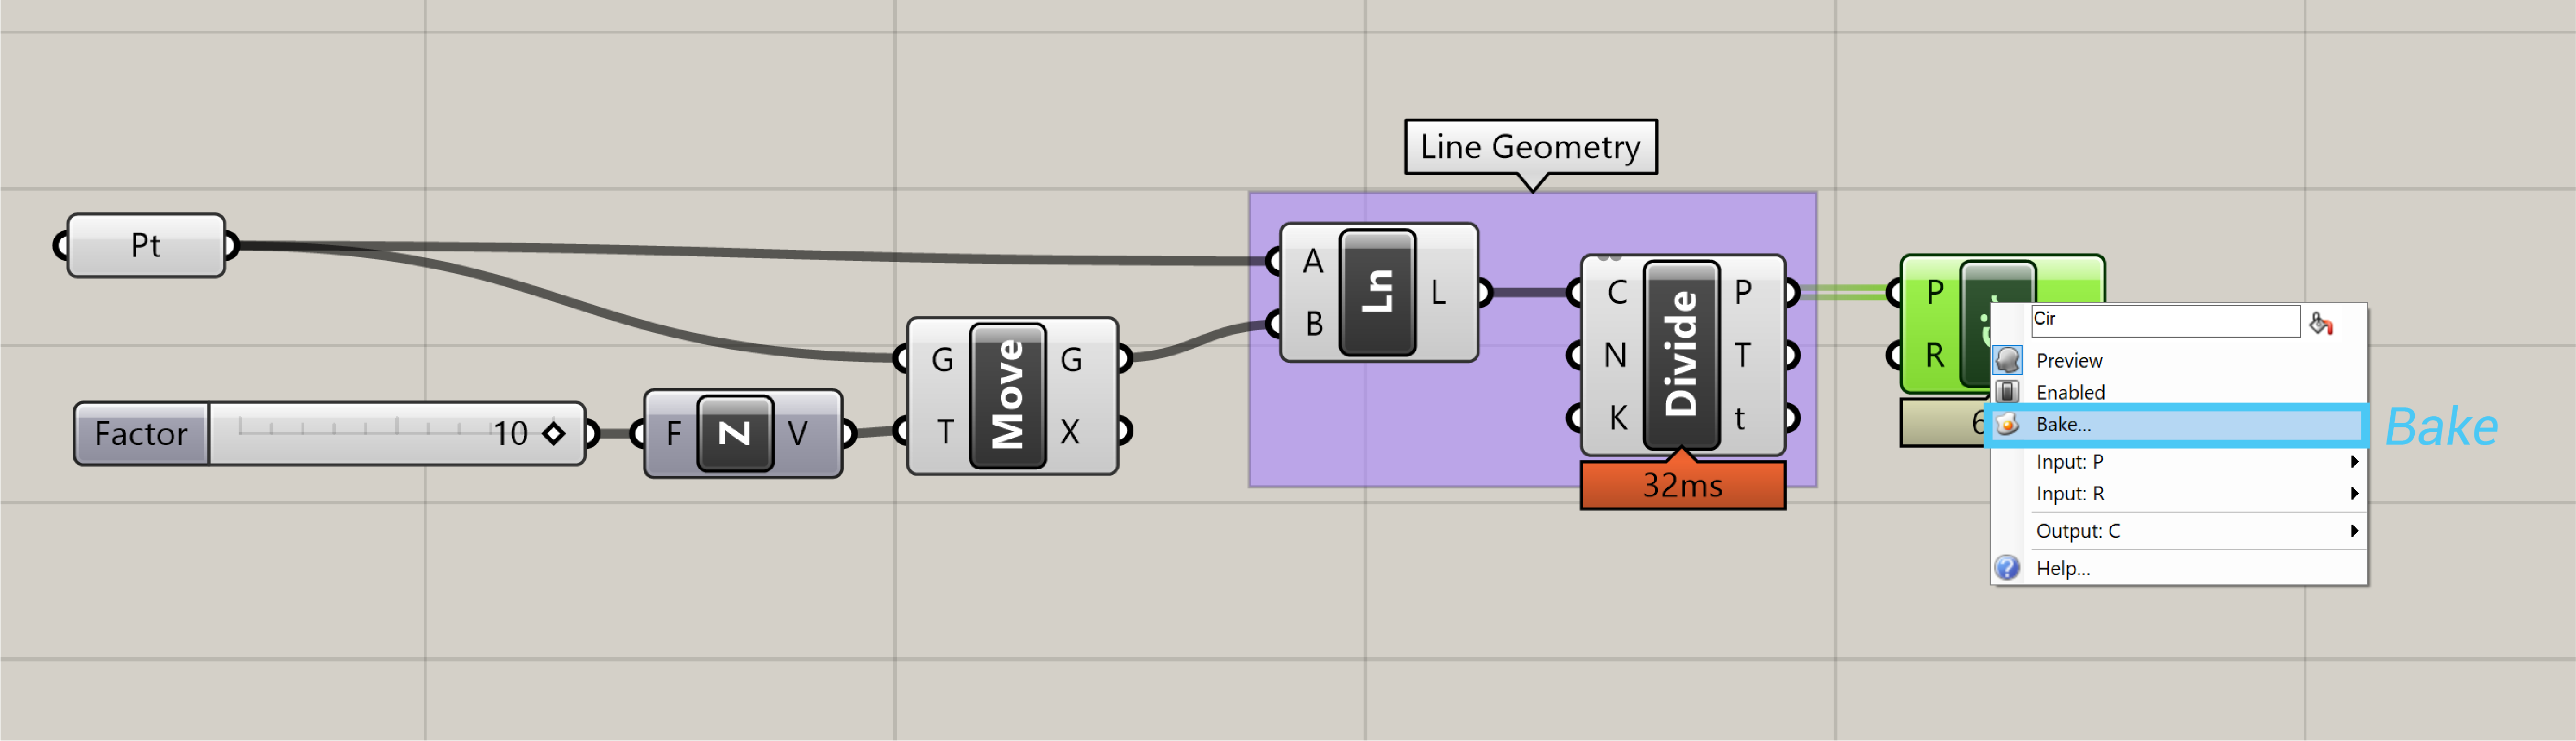
All geometry that is generated in Grasshopper will show up in the Rhino viewport. This preview is just an Open GL approximation of the actual geometry, and you will not be able to select the geometry in the Rhino viewport (you must first bake it into the scene). You can turn the geometry preview on/off. The geometry in the viewport is color coded to provide visual feedback. The image below outlines the default color scheme.
Baking Geometry
In order to select, edit, transform, etc… geometry in Rhino that was created in Grasshopper, you must “bake” it and it will no longer be responsive to the changes in your definition.
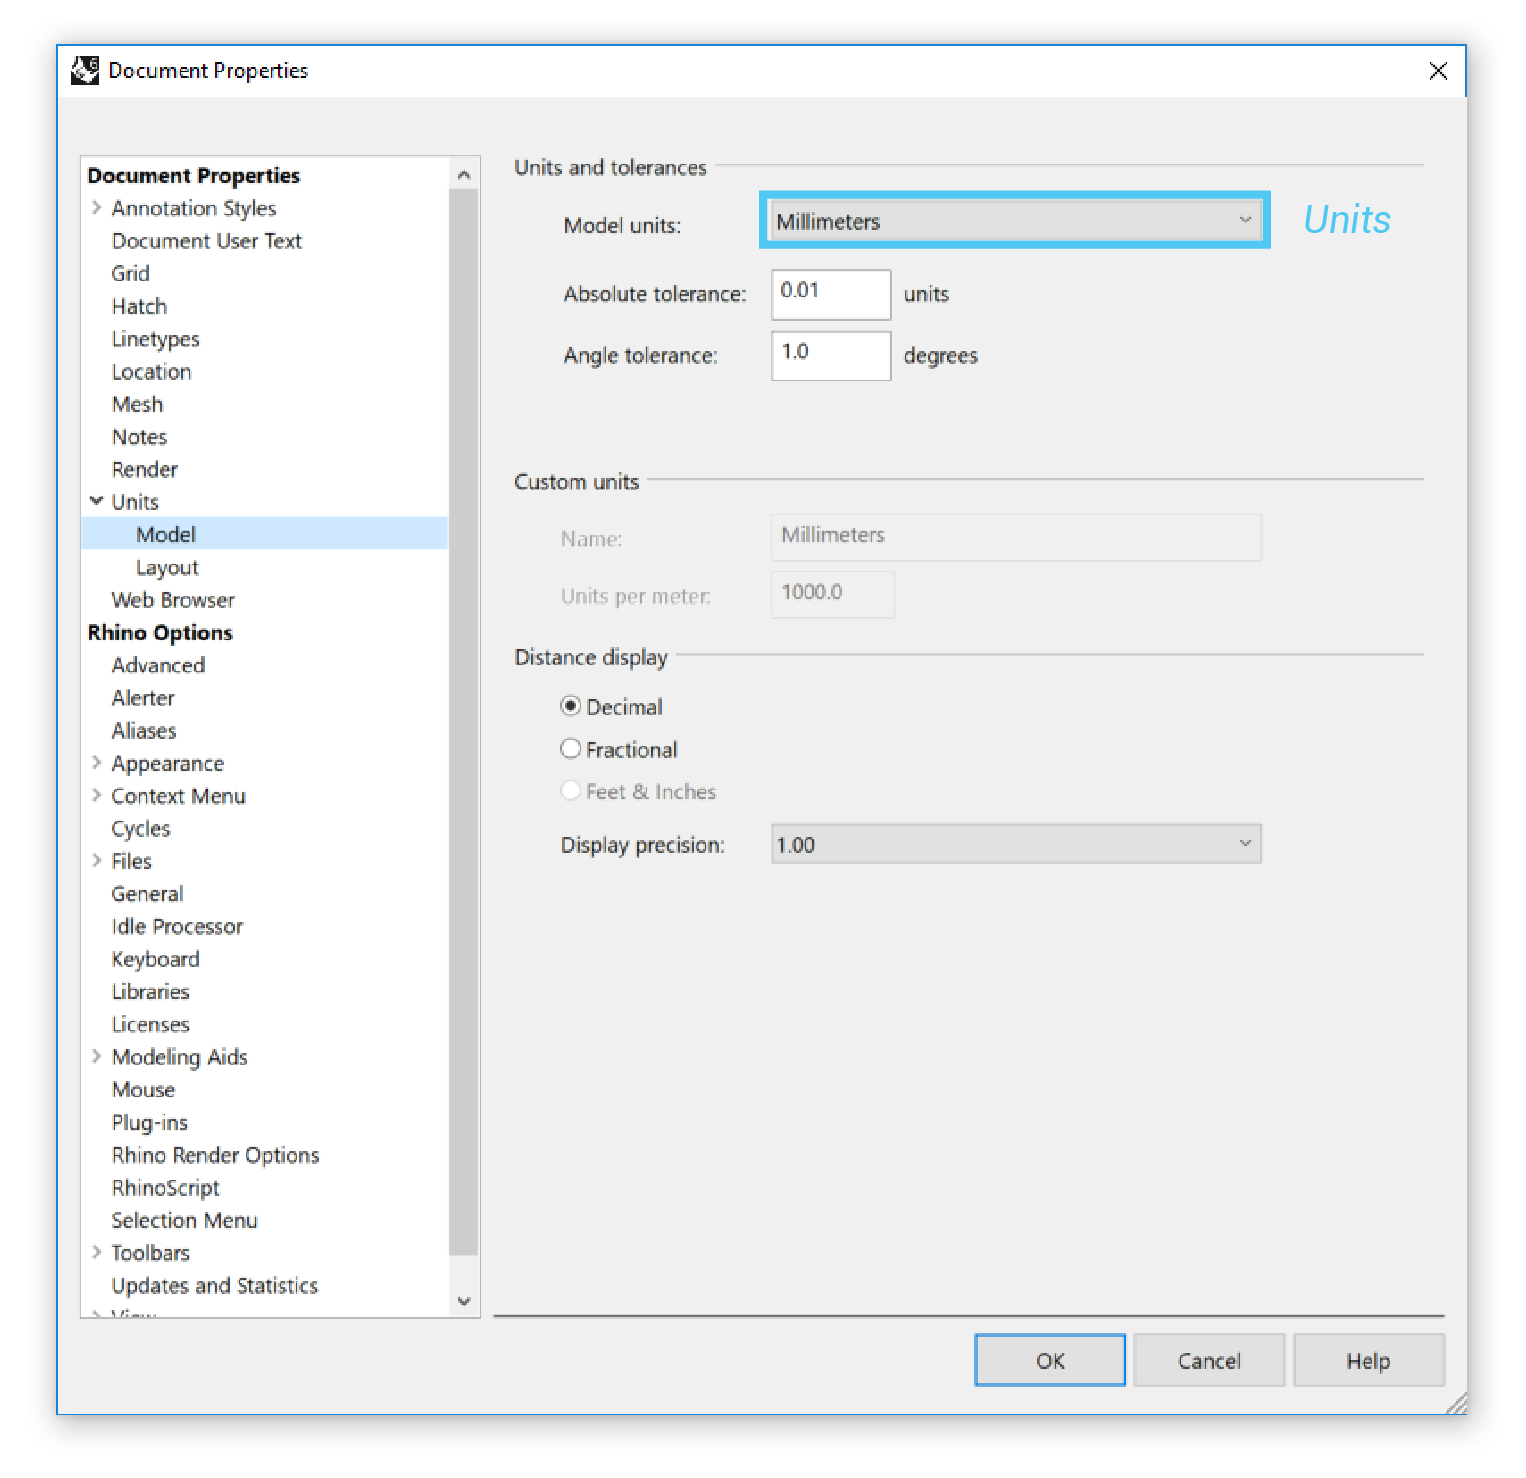
Units
Grasshopper inherits units and tolerances from Rhino. To change the units, type Document Properties in the Rhino command line to access the Document Properties menu.
Components
Grasshopper allows you to create visual programming called definitions. These definitions are made up of nodes connected by wires.
Components execute actions based on the inputs they. There are manytypes of components for different tasks.
Parameters
Parameters store the data that we send in our definitions. Parameters are usually shown as small rectangular boxes with a single input and single output. All parameter objects have a hexagonal border around their icon.

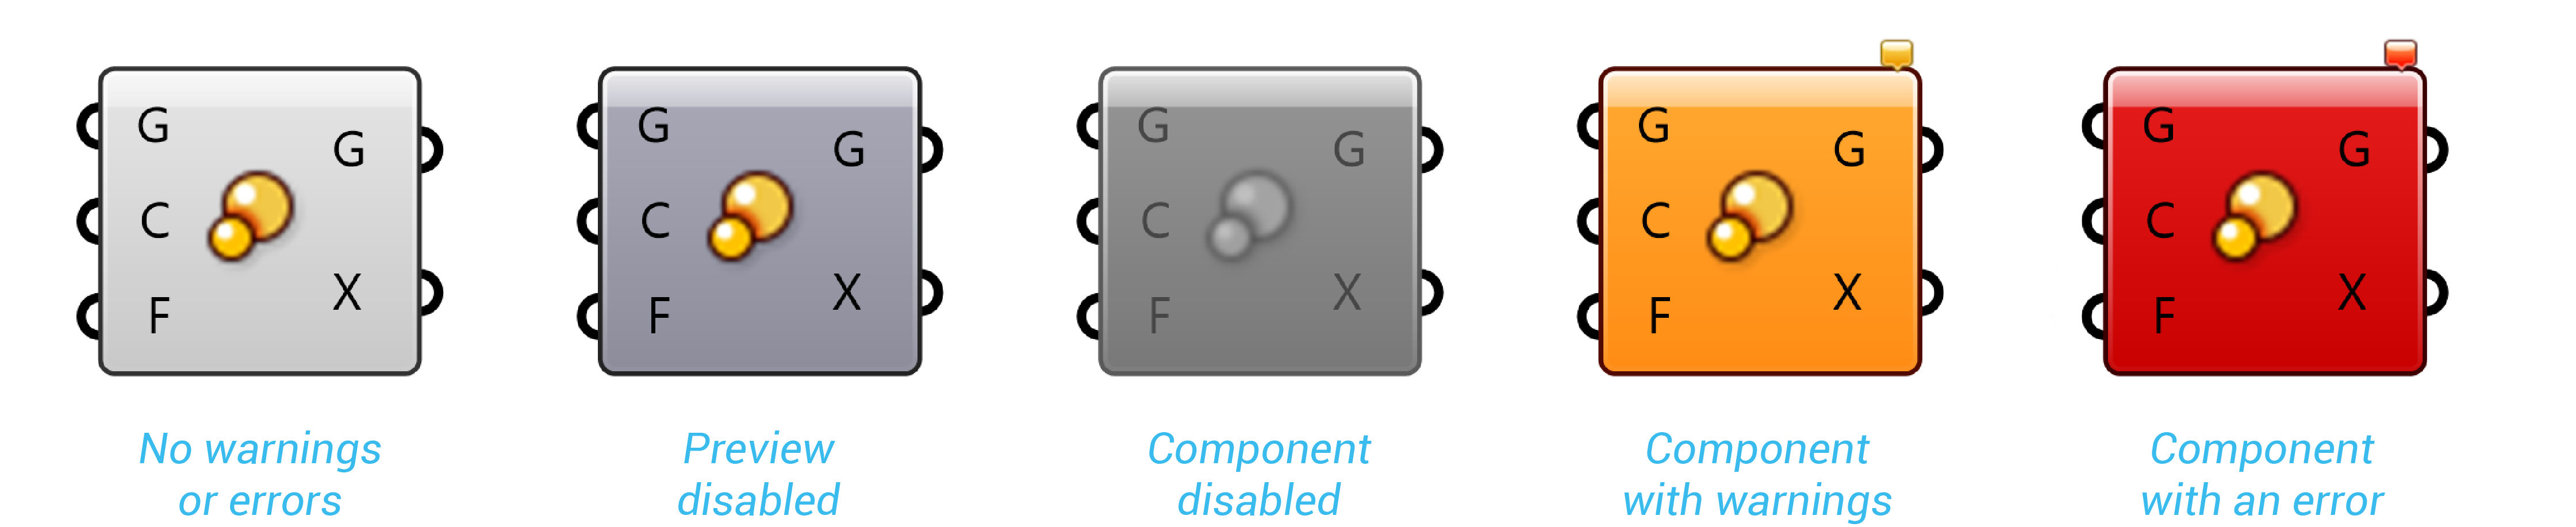
Component Colors
We can glean some information about the state of each object based on their color.
A parameter which contains warnings is displayed as an orange box.

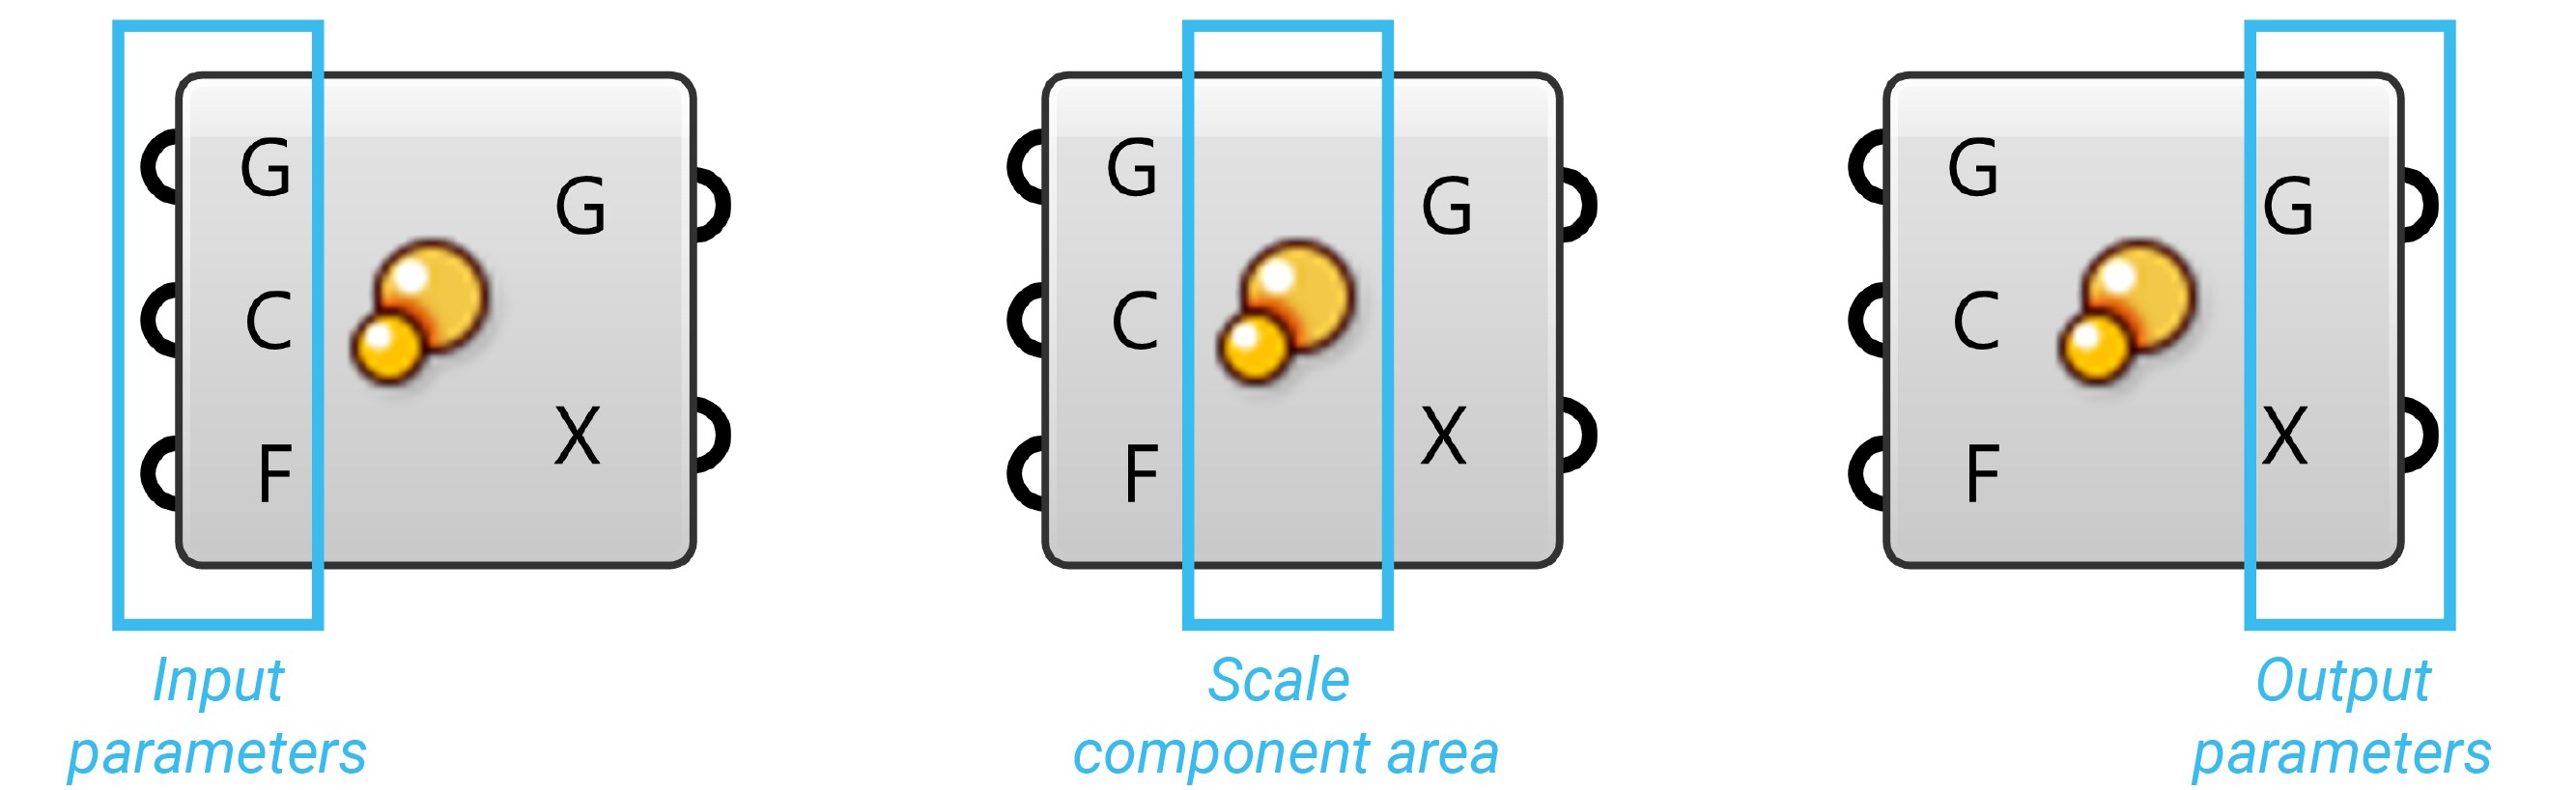
Parts
Components have inputs and outputs and requires data in order to perform its actions.
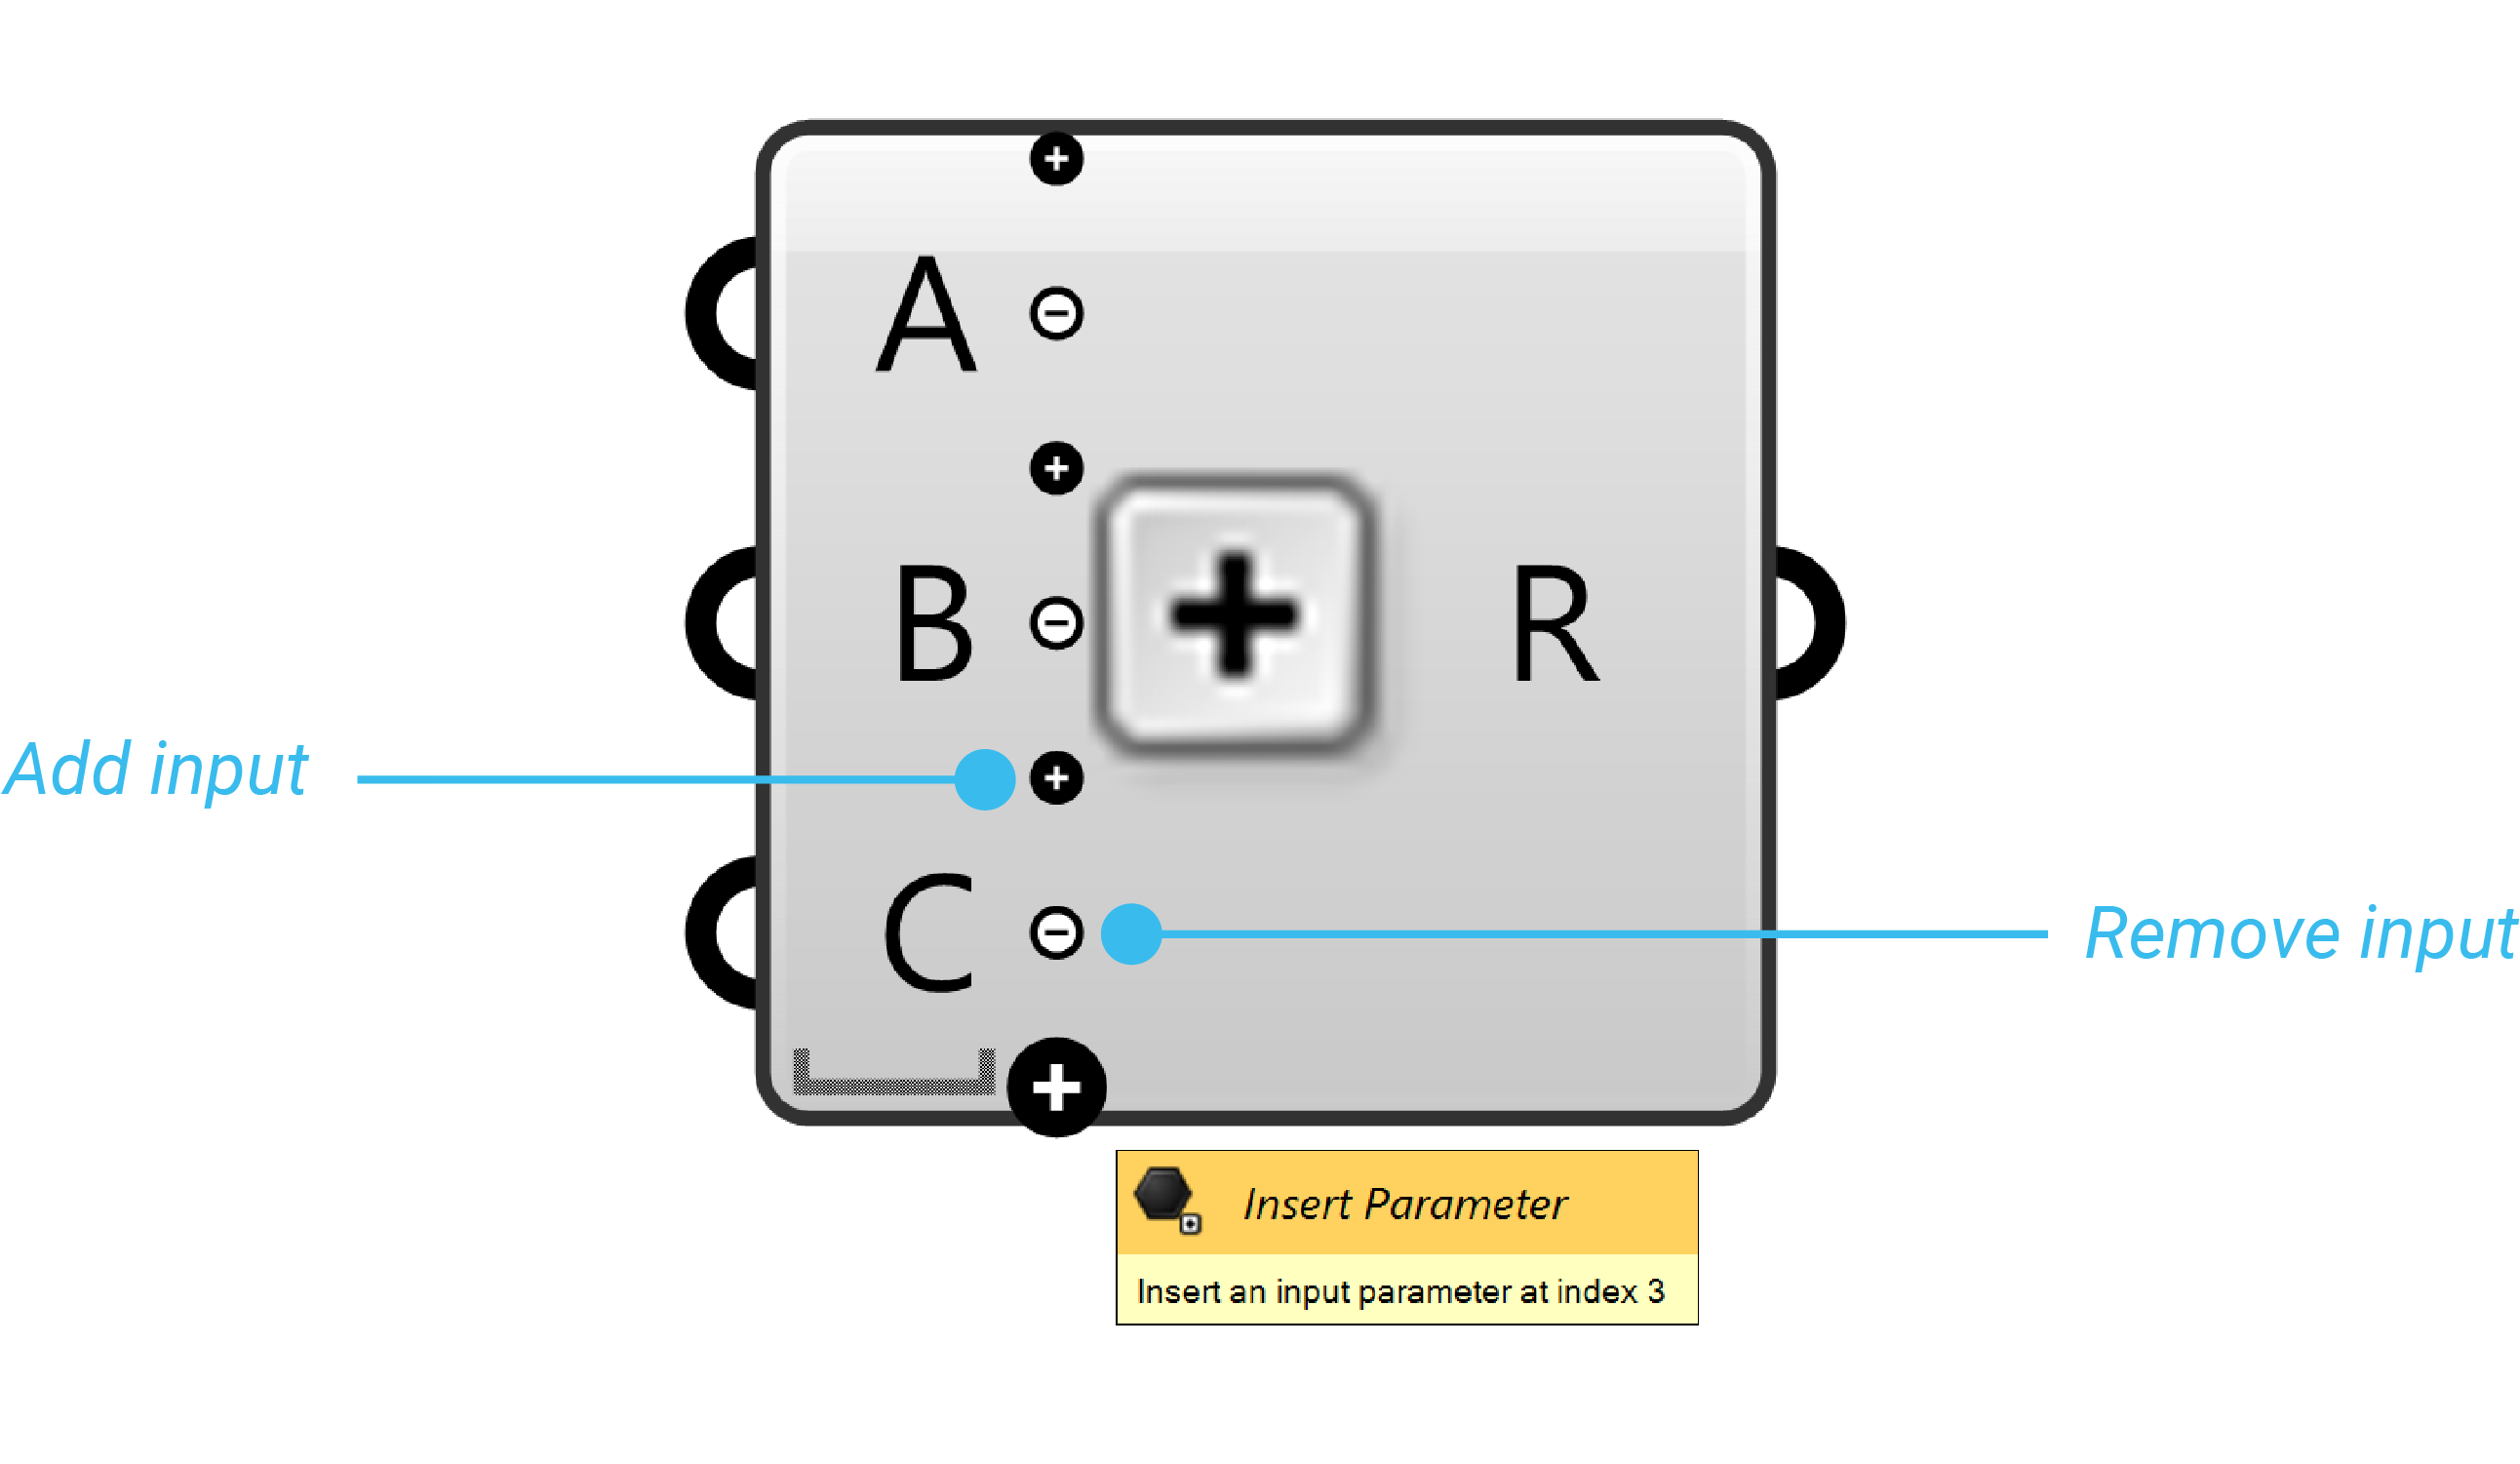
Zoom (ZUI)
Some components can be modified to increase the number of inputs or outputs through the Zoomable User Interface (ZUI). By zooming in on the component on the canvas, an additional set of options will appear which The panel component also has a zoomable user interface.
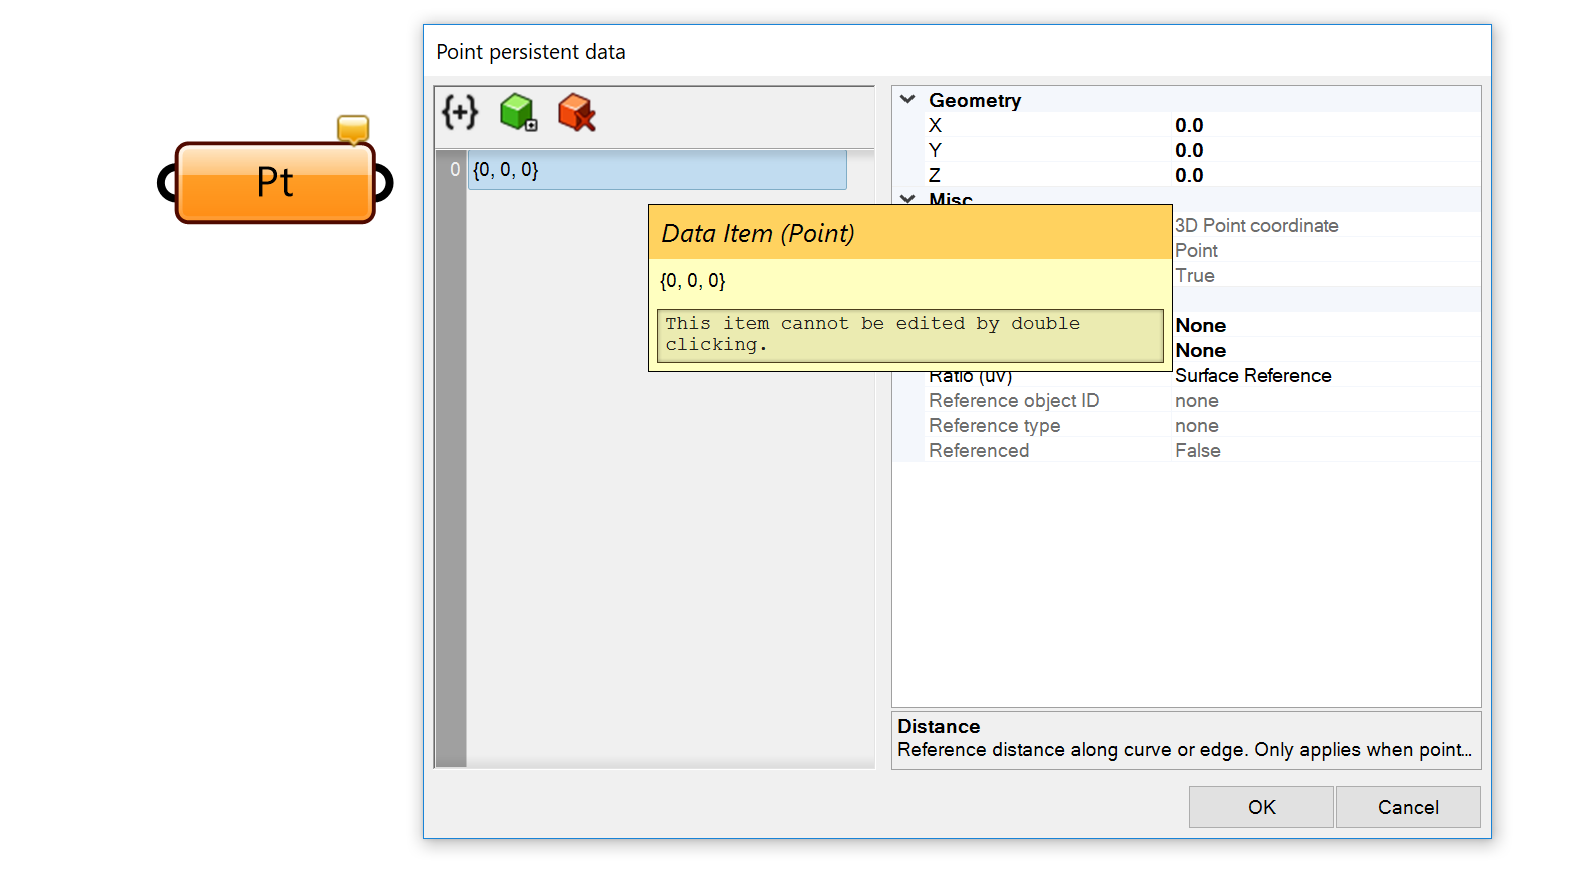
Data
Most parameters can store two different kinds of data: Volatile and Persistent. Volatile data is inherited from one or more sources and is modified whenever a new solution starts. Persistent data is data which has been specifically set by the user.
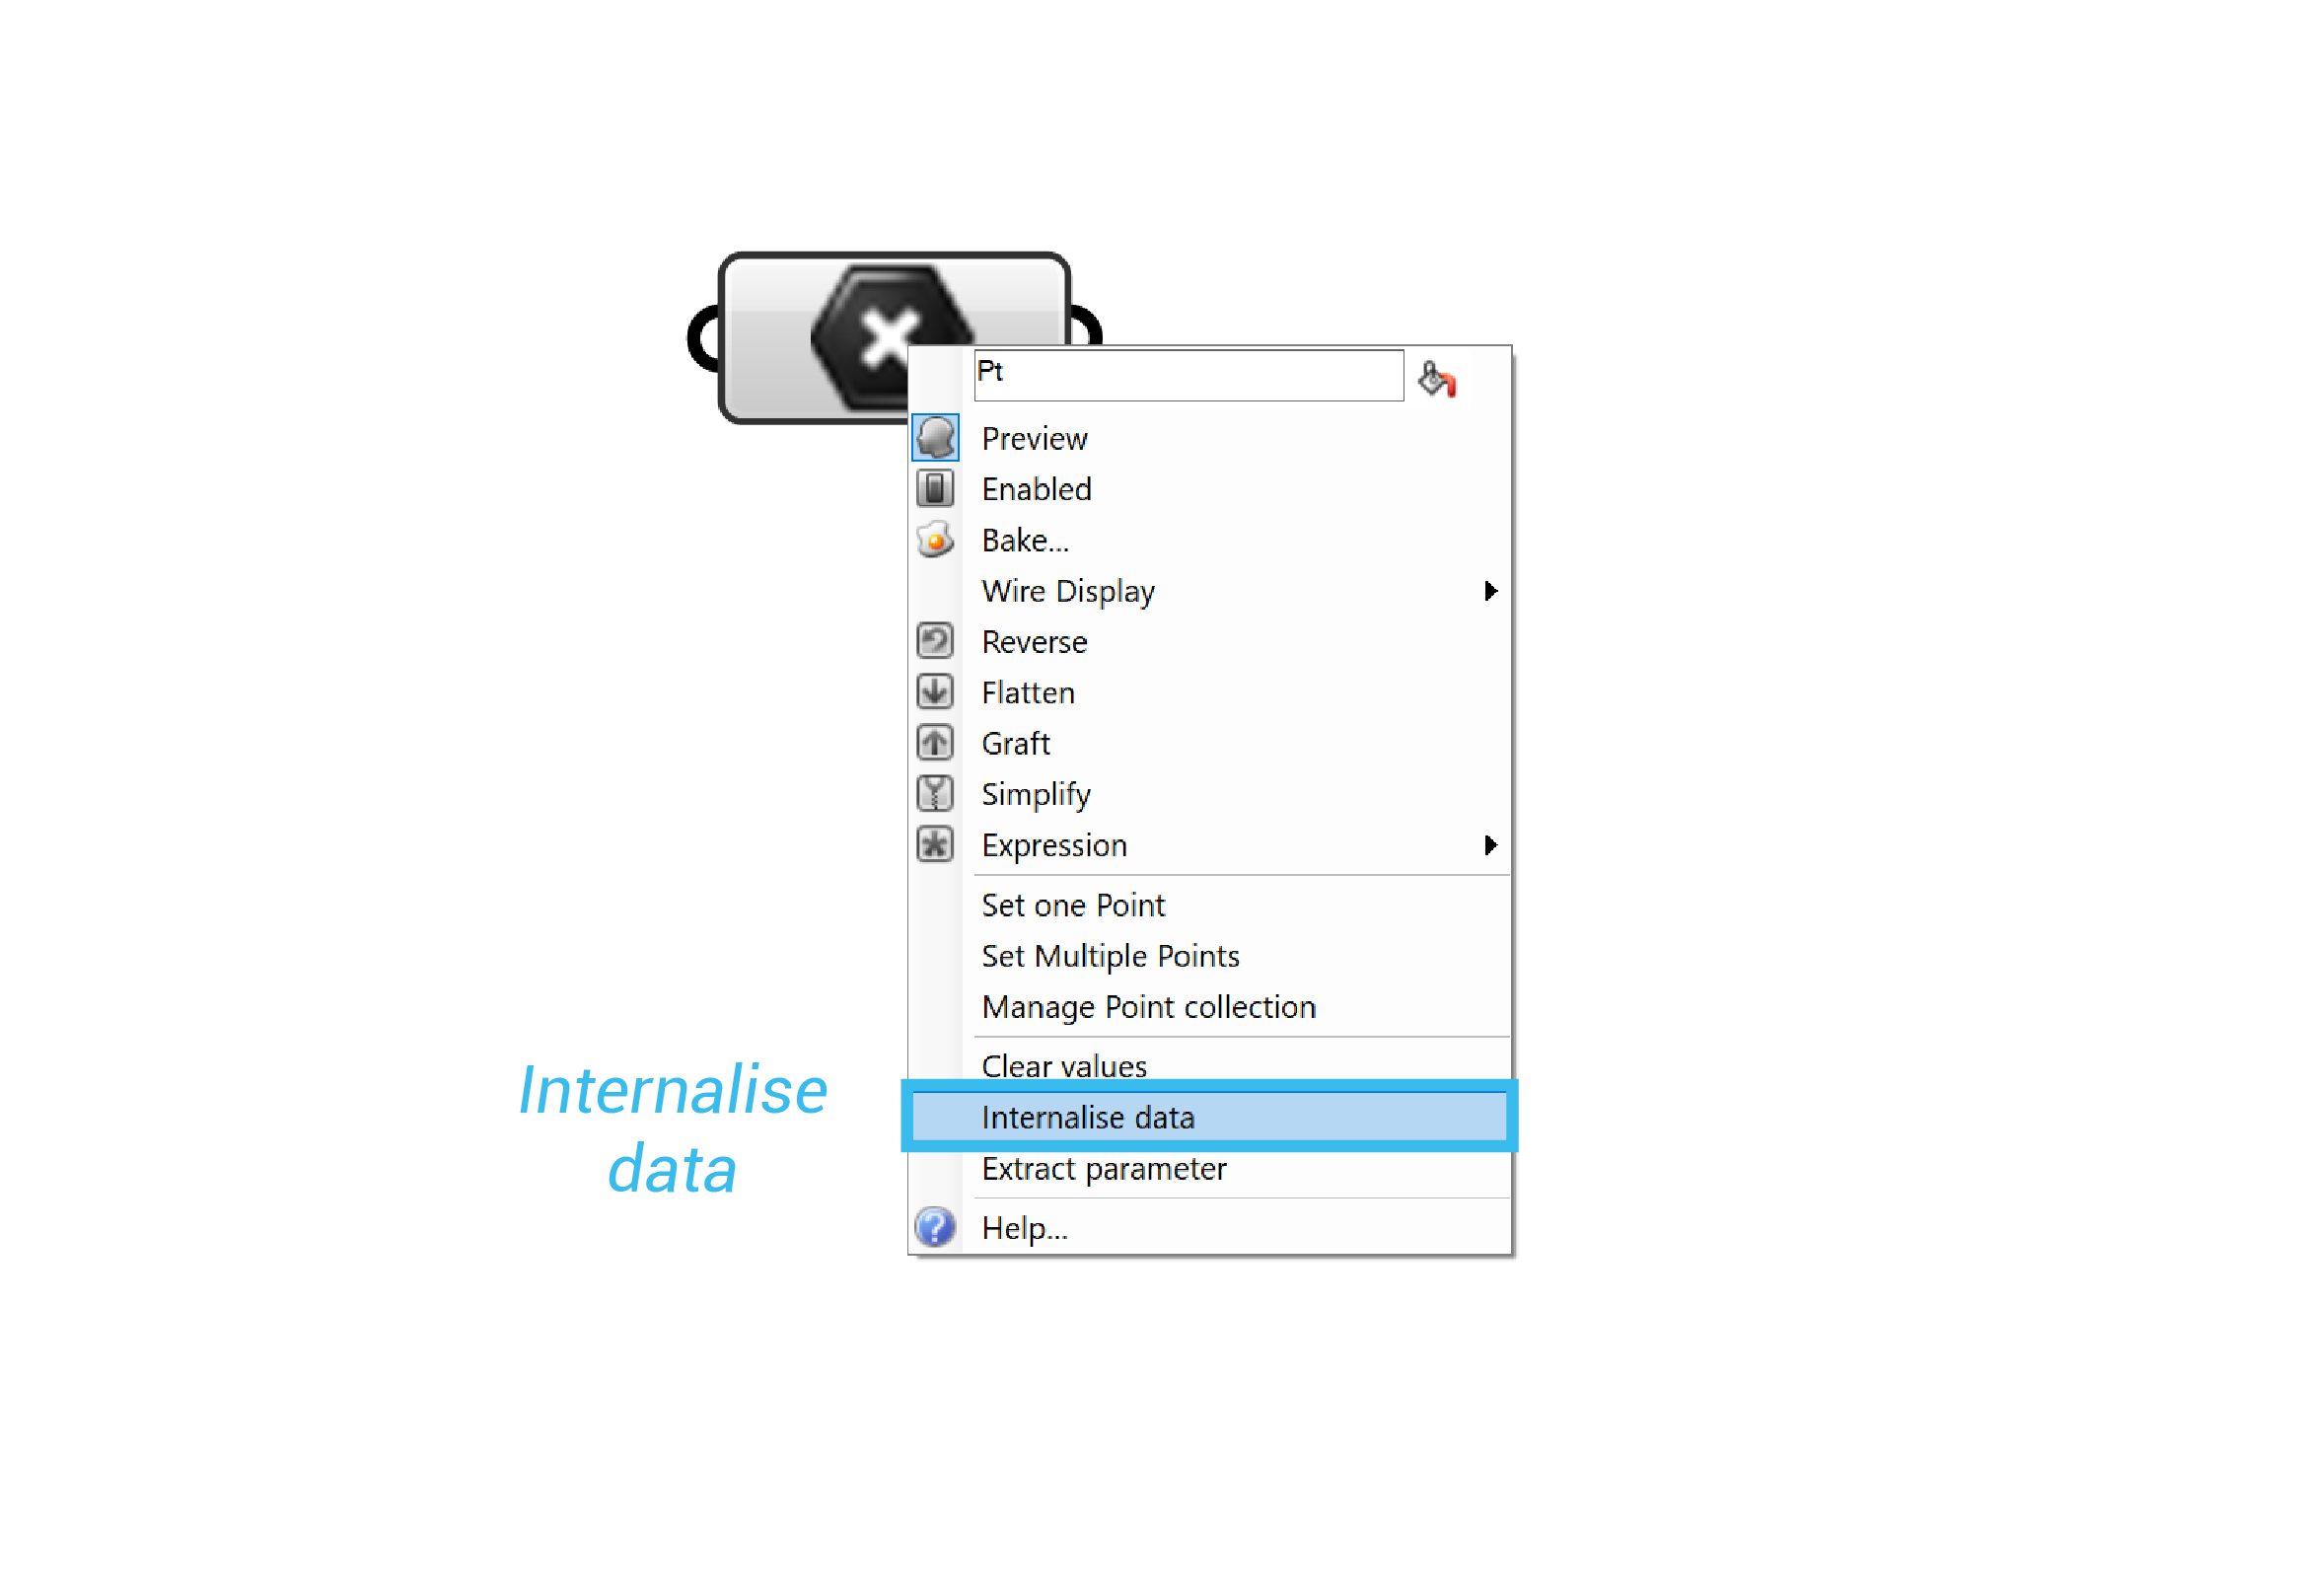
Internalize data
You can internalize data in a component input. The data in this case has been changed from volatile to persistent, and will no longer update.
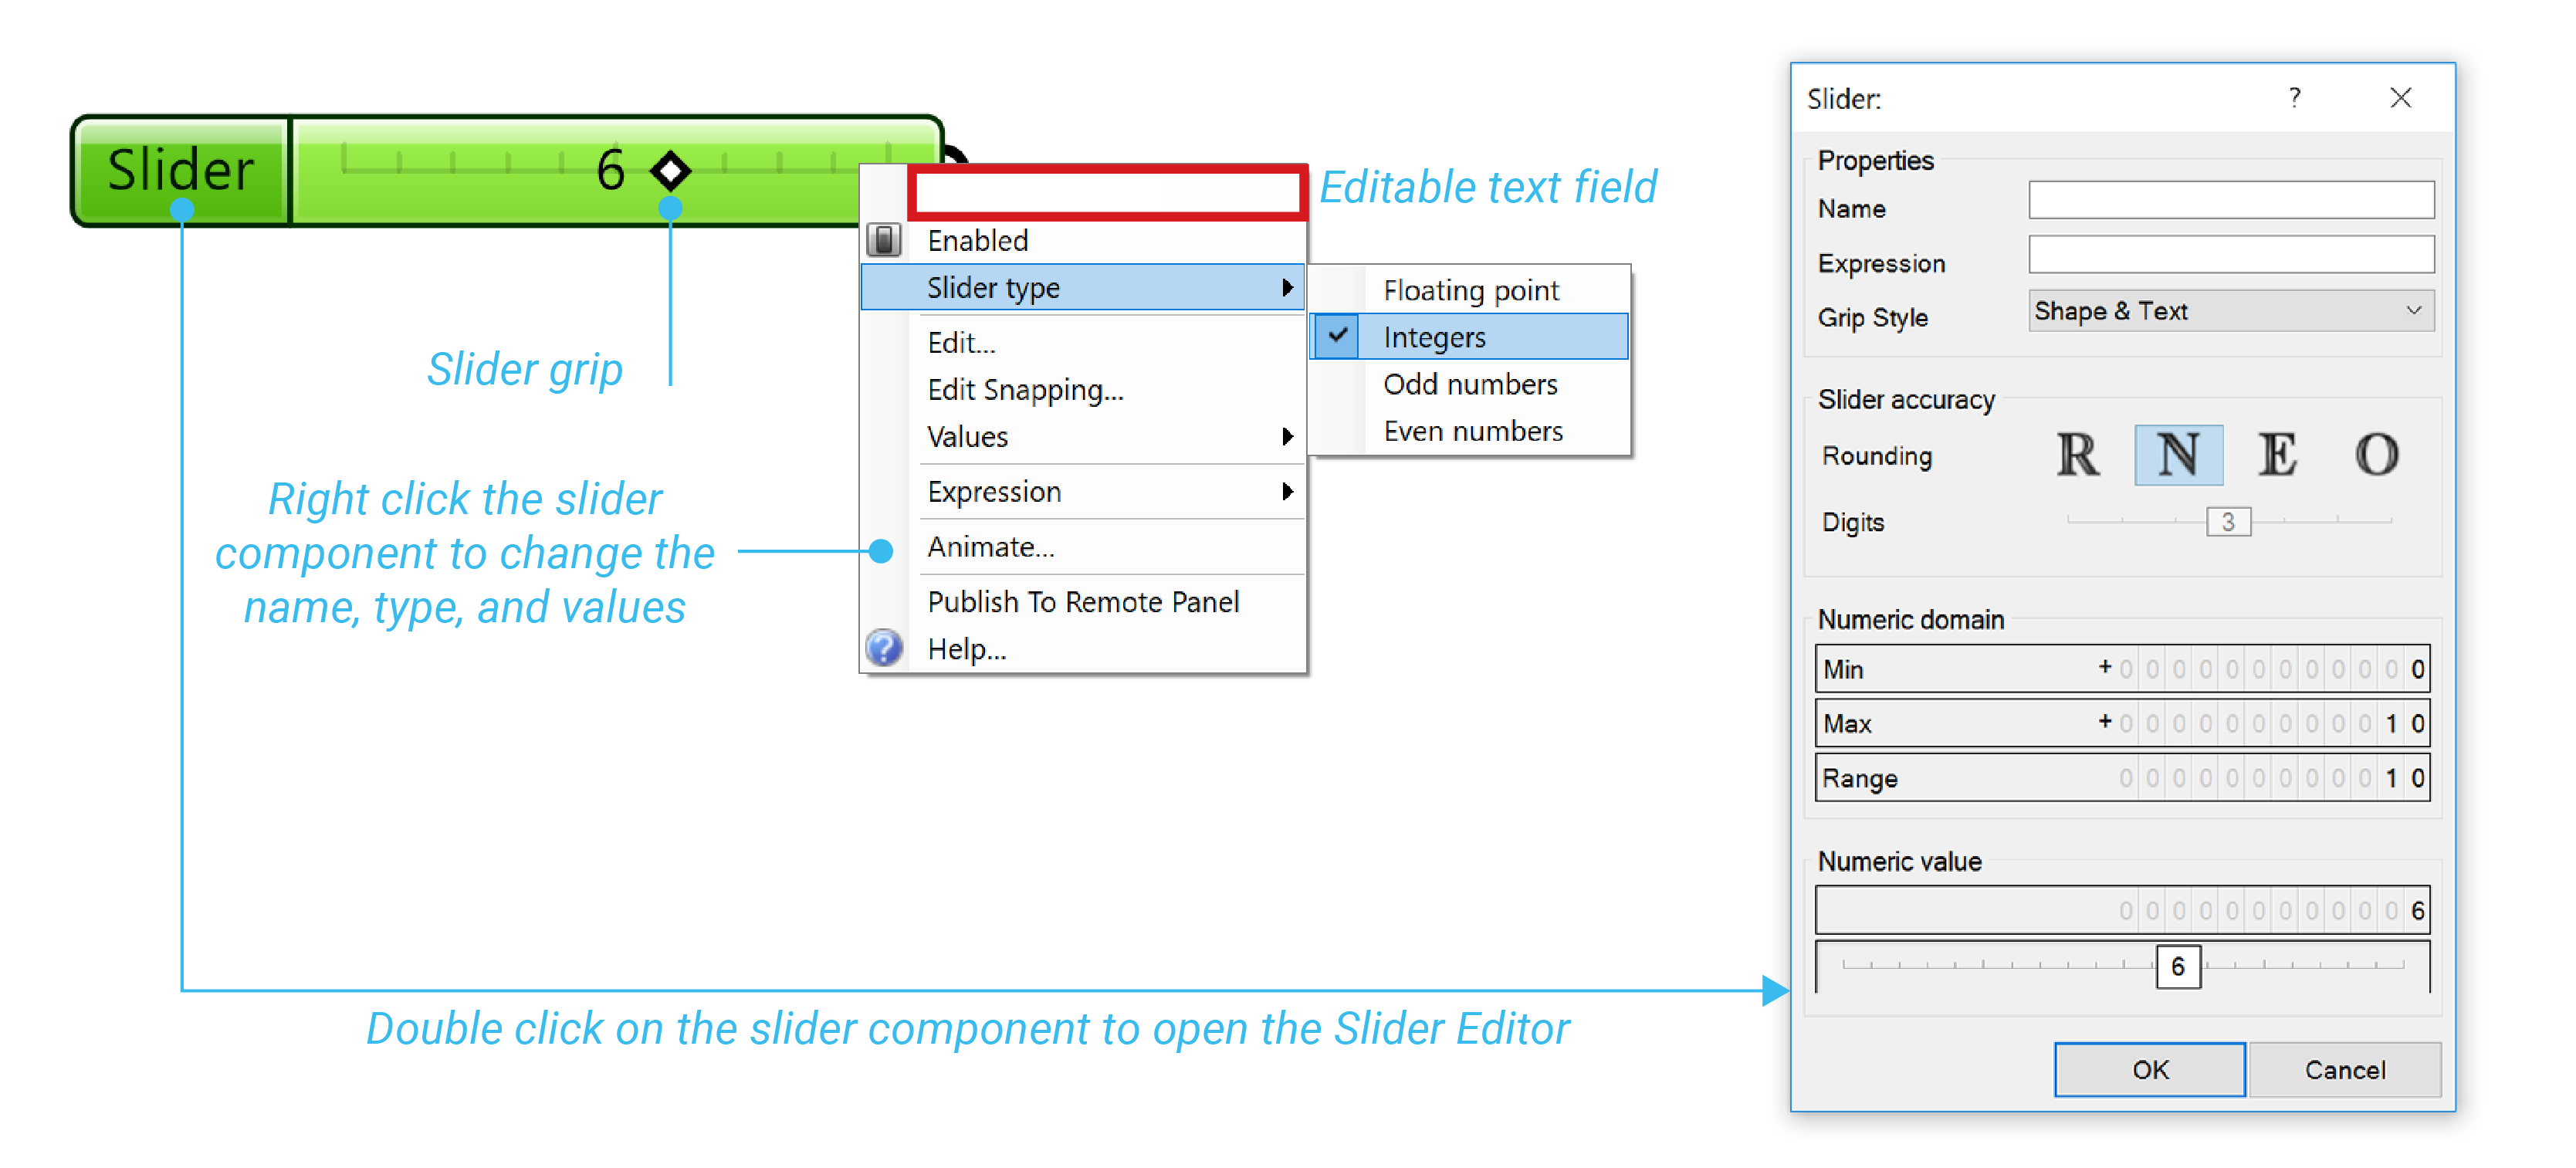
Input parameter
The number slider is the most important and widely used Input Parameter. It allows us to output a value between two given extremes by interacting with its grip with our mouse. Sliders can be used to specify a value and see the change to our definition that comes with adjusting the grip, but a slider should also be thought of as the means to identify successful ranges of our definition.
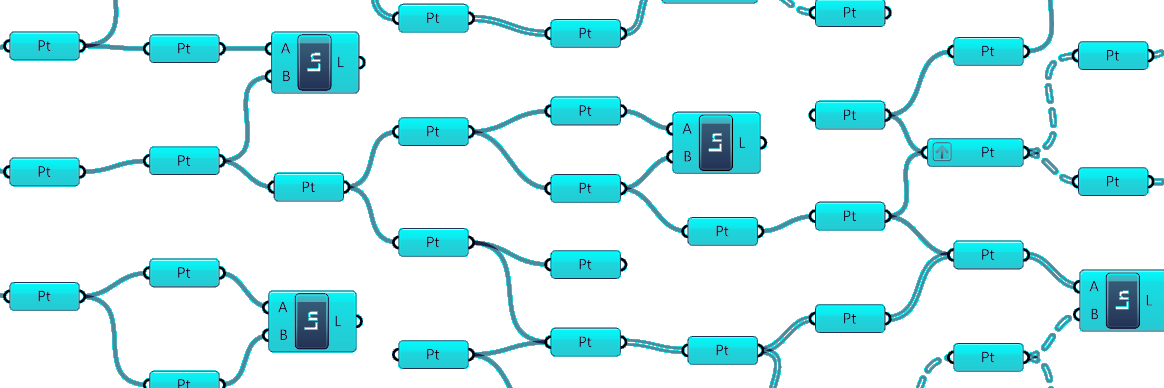
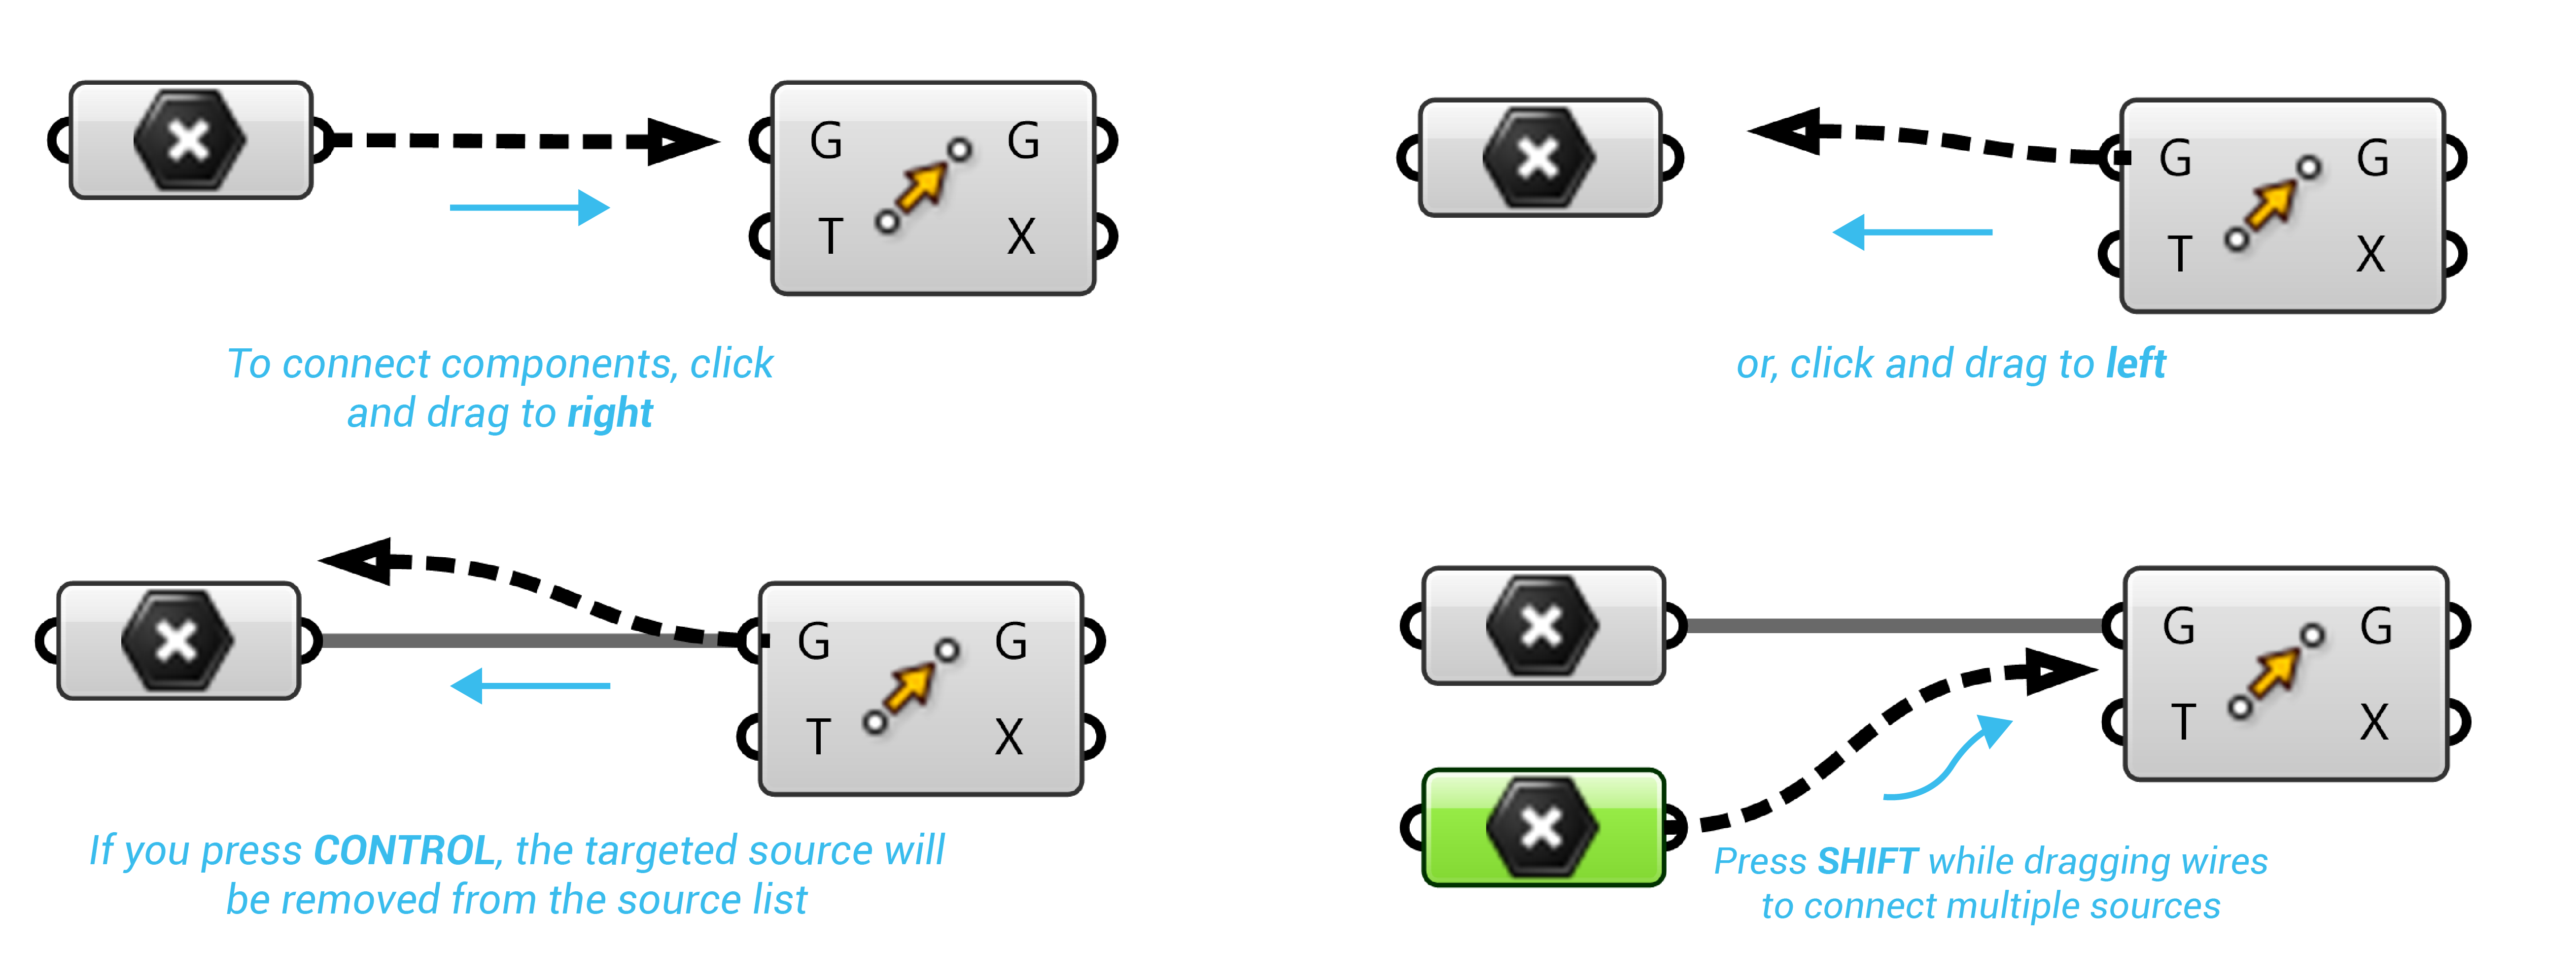
Wiring
To connect components, click and drag near the circle on the output side of an object. The connection turn permanent when you release the mouse button. It doesn’t matter if we make the connections in a ‘left to right’ or ‘right to left’ manner.
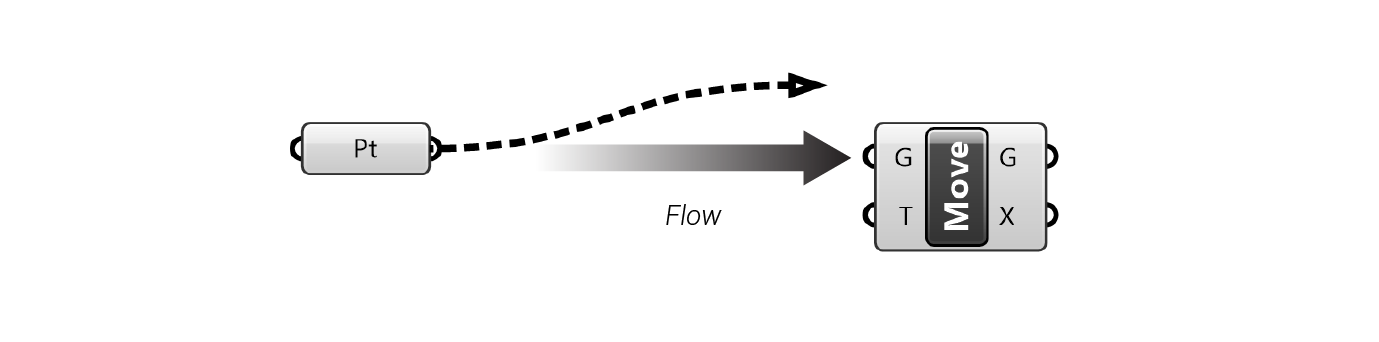
Fancy wires
Wires represent the connections as well as the flow of data. Grasshopper can also give us visual clues as to what is flowing through the wires. You have to enable “fancy wires” to view the different types of lines. To do this, simply click on the Display Tab and select “Draw Fancy Wires”.
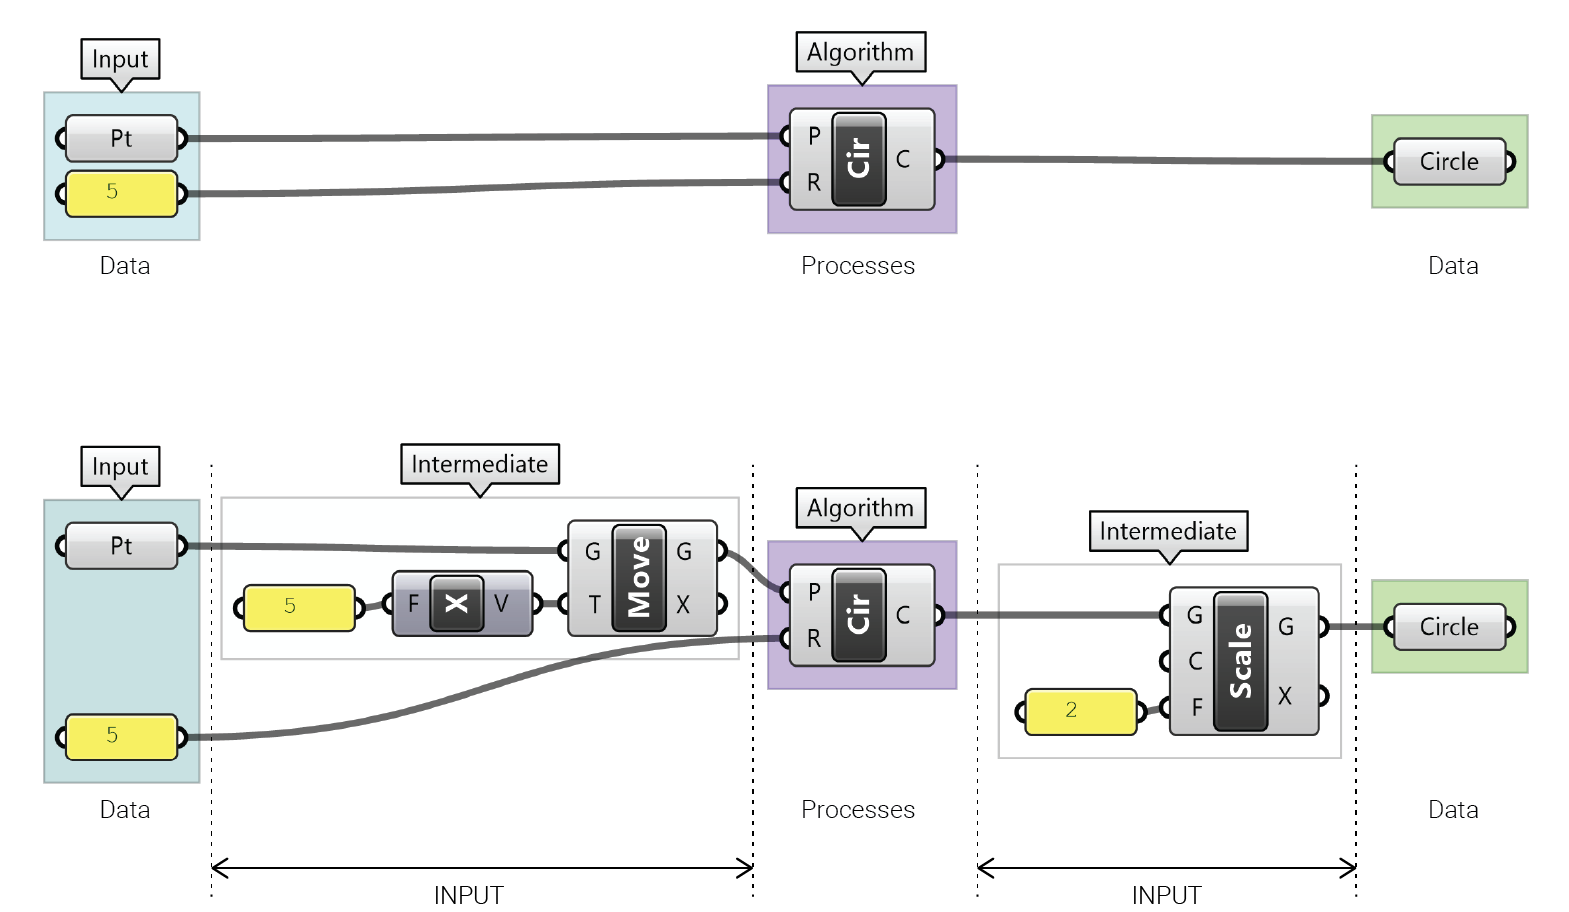
Algorithms and Data
How to build algorithms:
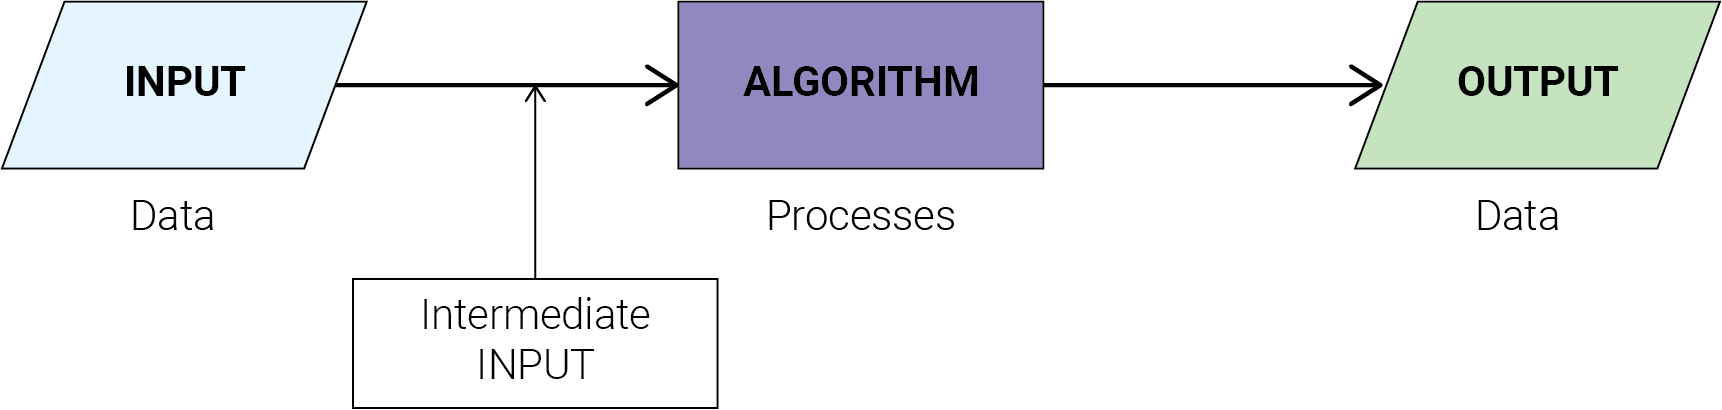
Example:
Data sources
How to store data?
Internal
Set inside the parameter.
Referenced
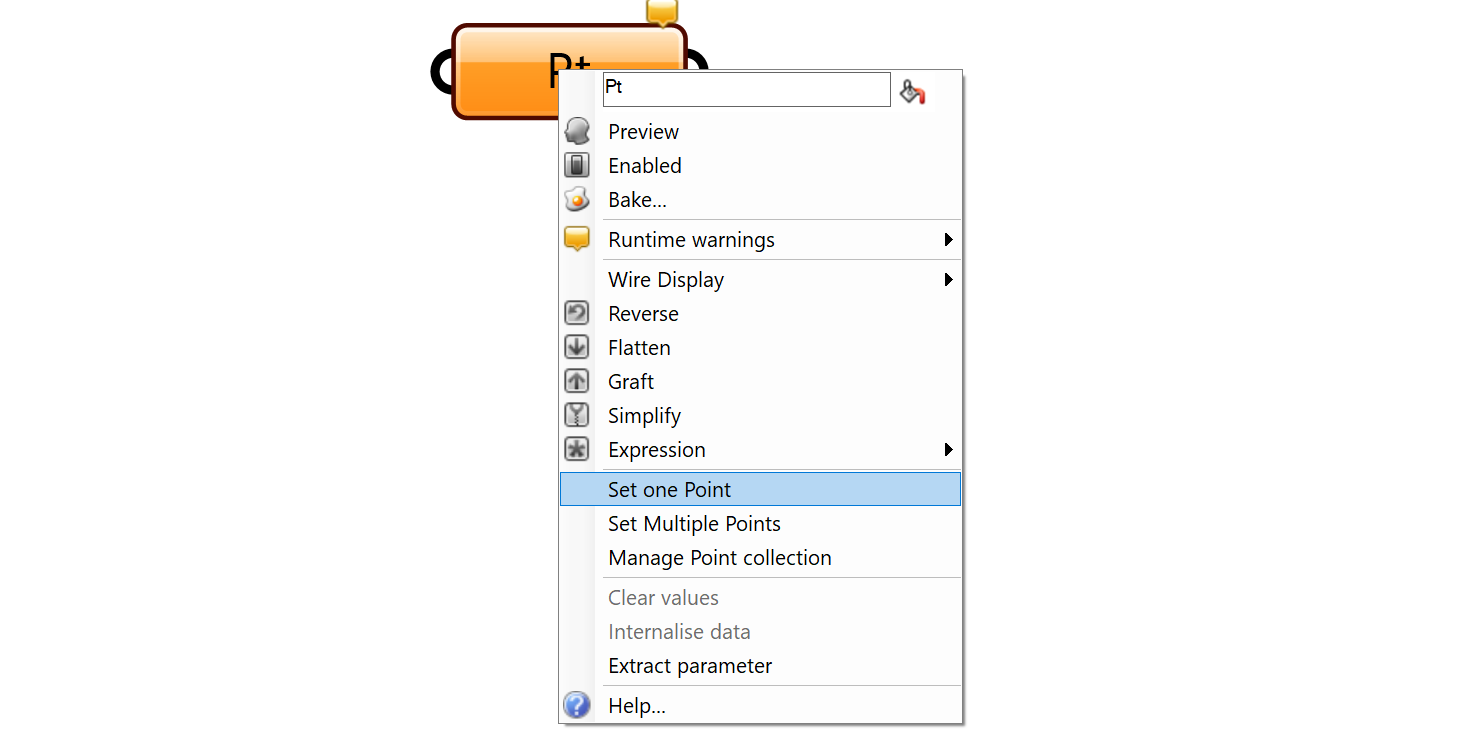
Right mouse click the component, then “Set one point” to reference in Rhino.
External
Supplied to the component.

System Data Types
In computer science and computer programming, a data type or simply type is an attribute of data which tells the compiler or interpreter how the programmer intends to use the data. (Source: Wikipedia)
String
A string represent text.

i.e. the word “house” and the phrase “Hello world” are both strings. Even “12345” could be considered a string.
Number
Most common number data types:
Integer: stores whole numbers that range from -2,147,483,647 to 2,147,483,647 for 9 or 10 digits of precision.

Floating points: represent values as high-precision fractional values.

Boolean
Represent the values True (1) and False (0)

Geometry Data Types
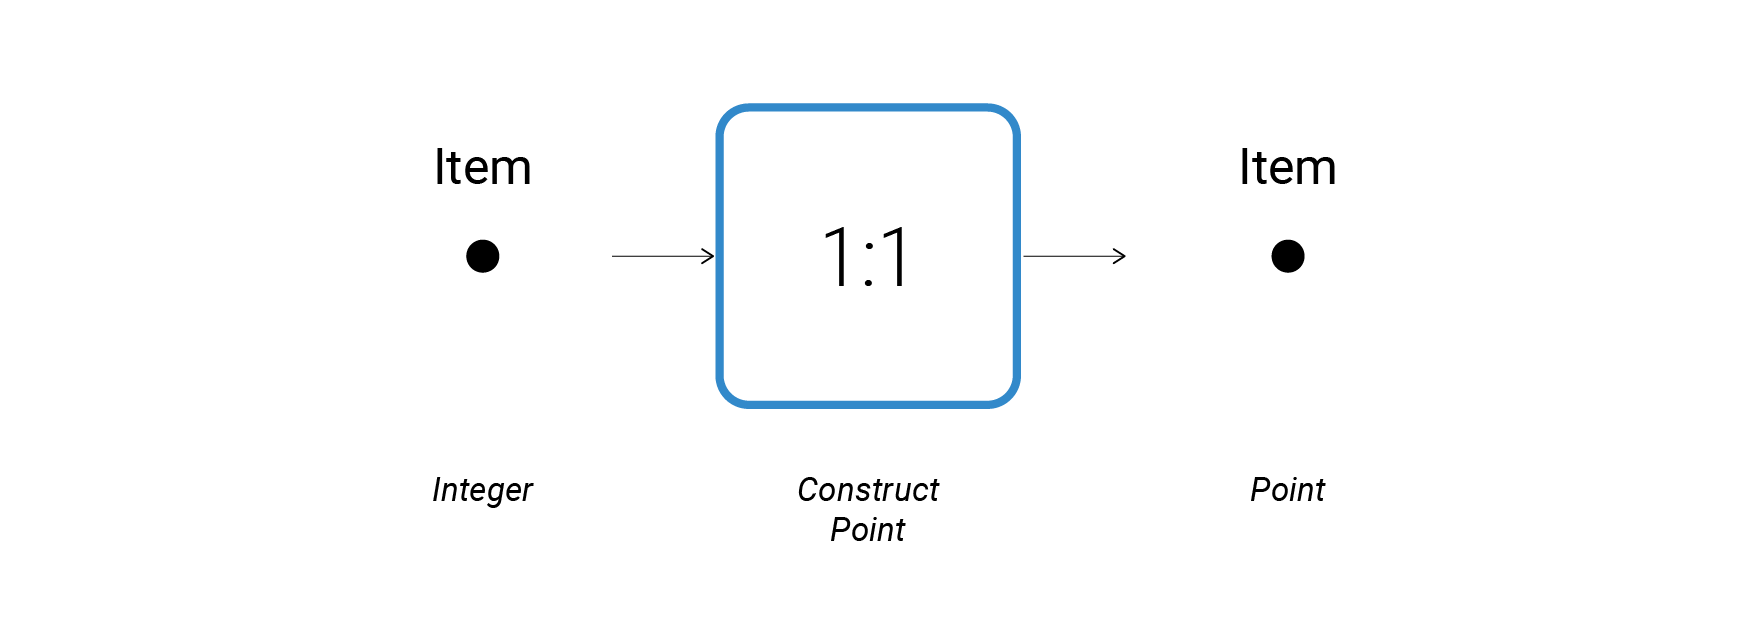
Point

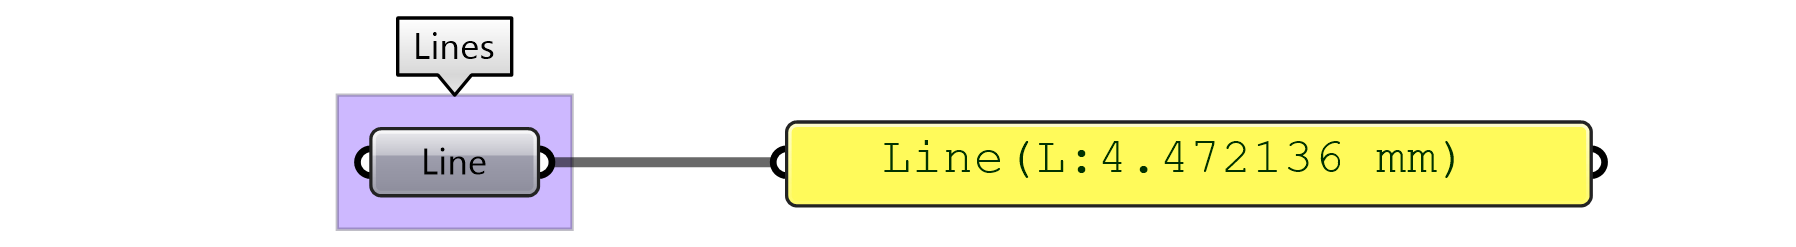
Line
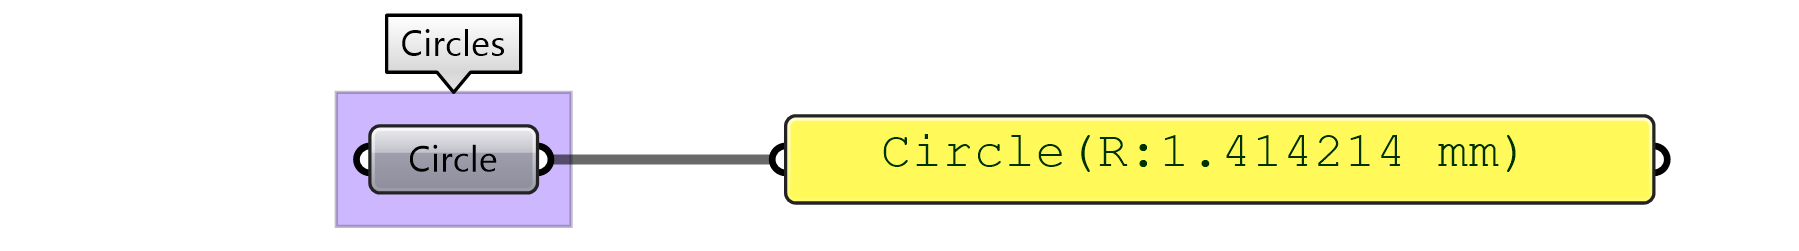
Circle, etc…
Computer graphics Data Types
Domain
Create a numeric domain from two numeric extremes

Vector
Contains a collection of three-dimensional vectors

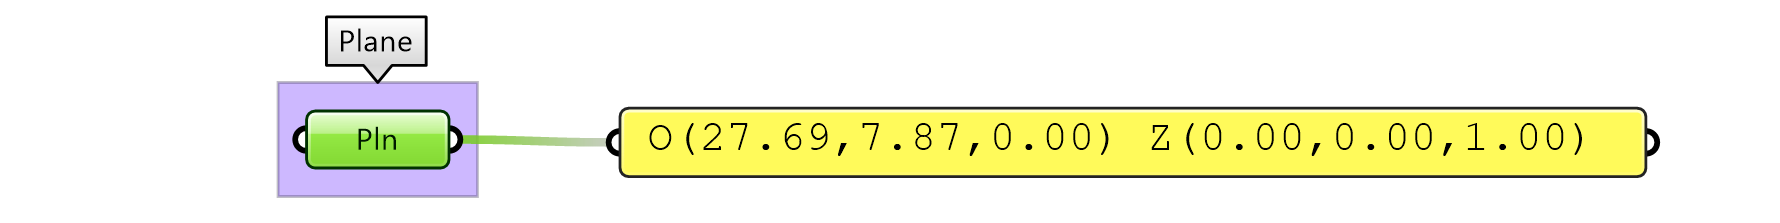
Plane
Contains a collection of three-dimensional axis-systems
etc…
Points, vectors and planes
Points, vectors and planes are the base for creating and transforming geometry in Grasshopper.

Points
Points in 3D space have three coordinates, usually referred to as [x,y,z]. Points in 2D space have only two coordinates which are either called [x,y] or [u,v] depending on what kind of two dimensional space we’re talking about.
Point = [x,y,z]

Vectors
A vector is a geometric quantity describing Direction and Magnitude. Vectors are abstract.
ie. they represent a quantity, not a geometrical element.
Right hand rule
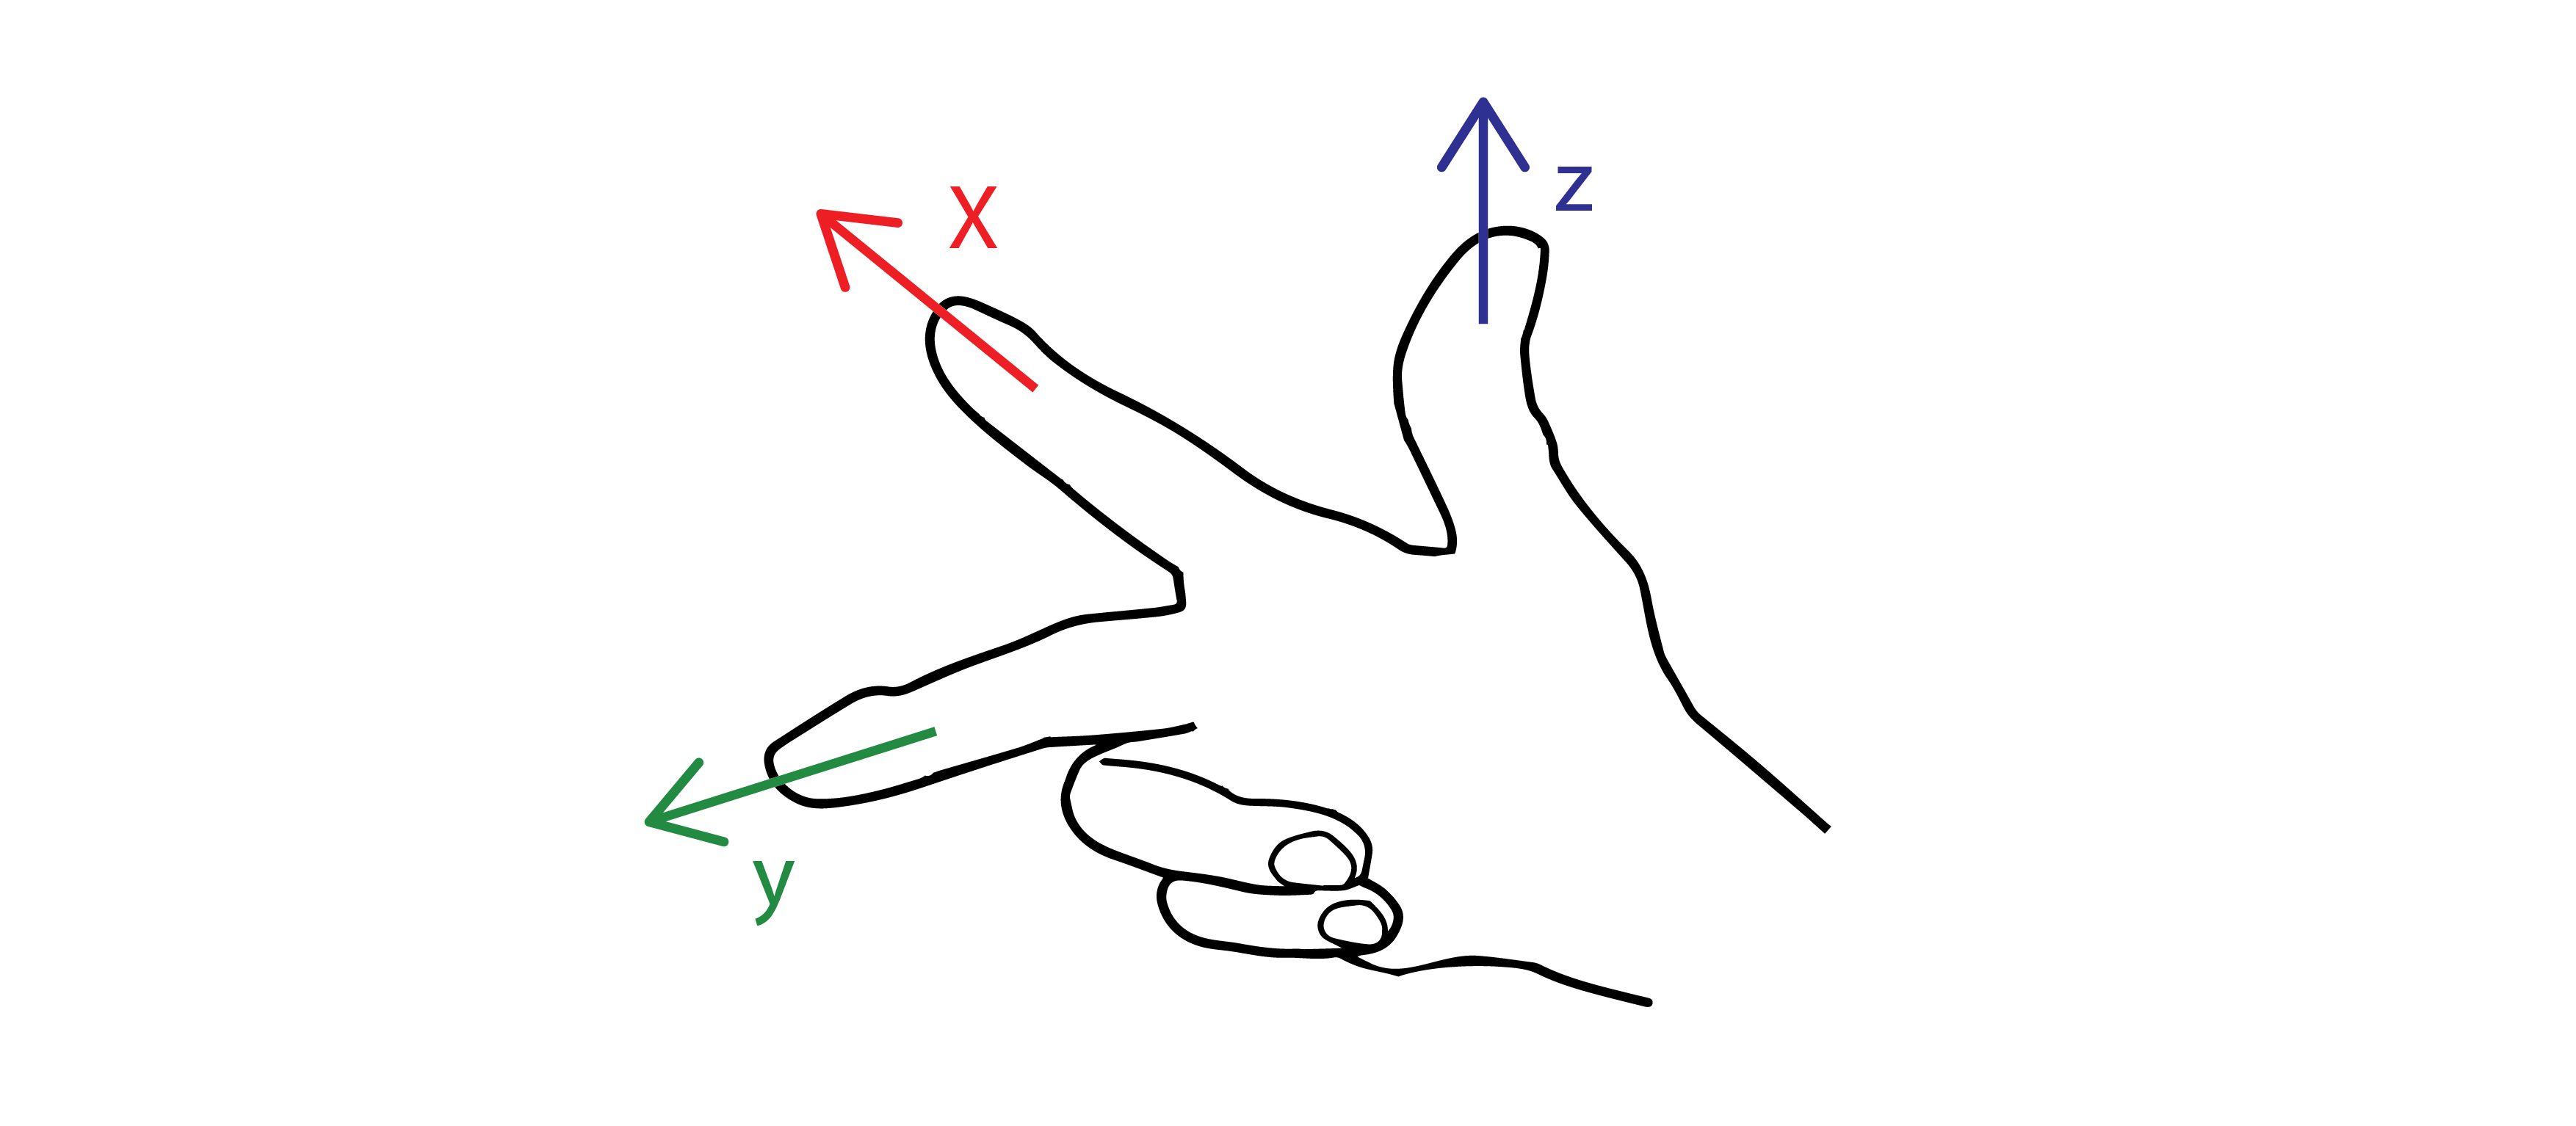
Vector and points are both lists of three numbers so there’s absolutely no way of telling whether a certain list represents a point or a vector. A vector is an arrow in space which always starts at the world origin (0.0, 0.0, 0.0) and ends at the specified coordinate.

Planes
Planes are “Flat” and extend infinitely in two directions, defining a local coordinate system.

Lists
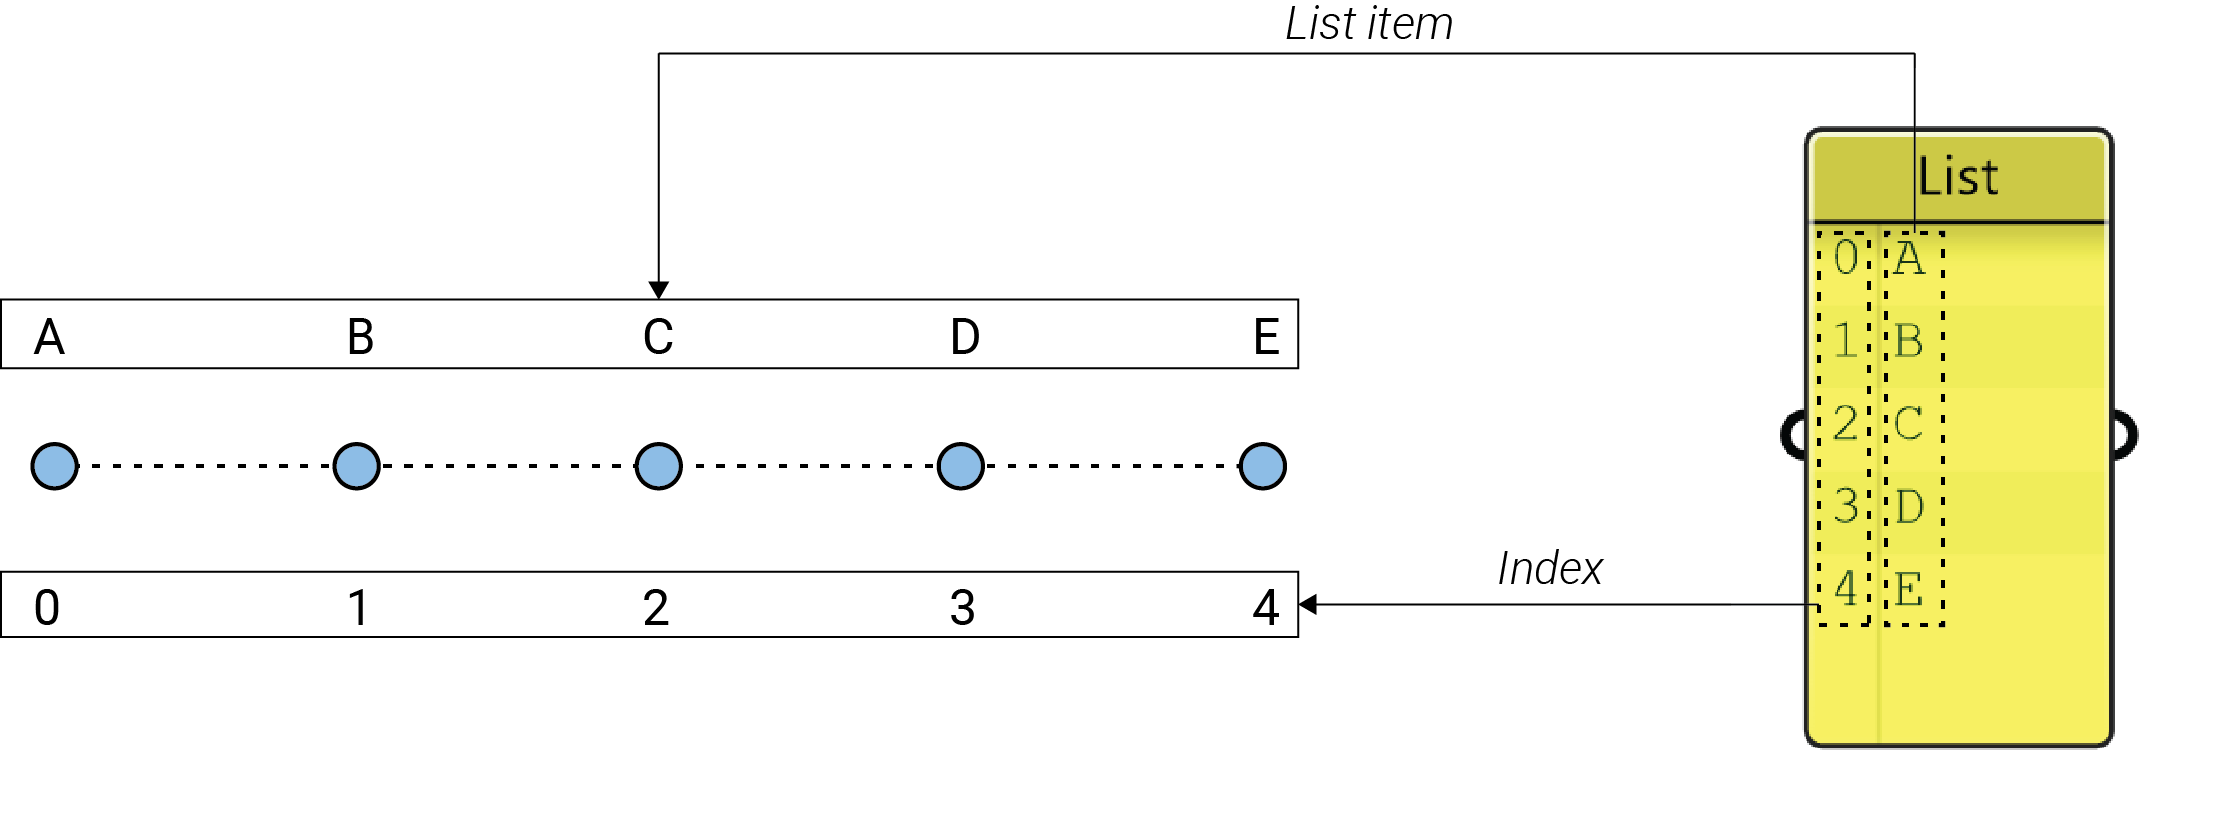
A list is an ordered (but not necessarily sorted) collection of data. Lists may contain zero elements, a single element, or (at most) 2,147,483,647 elements. Furthermore, the same element can occur more than once in the same list, and different elements with identical values can occur more than once. Also, a list may contain lack of elements, referred to as “nulls”.
When storing data in a list, it’s helpful to know the position of each item in that list so that we can begin to access or manipulate certain items. The position of an item in the list is called its index number.
The items being stored in the list can be any data type that Grasshopper supports, such as:
points, curves, surfaces, meshes, etc…
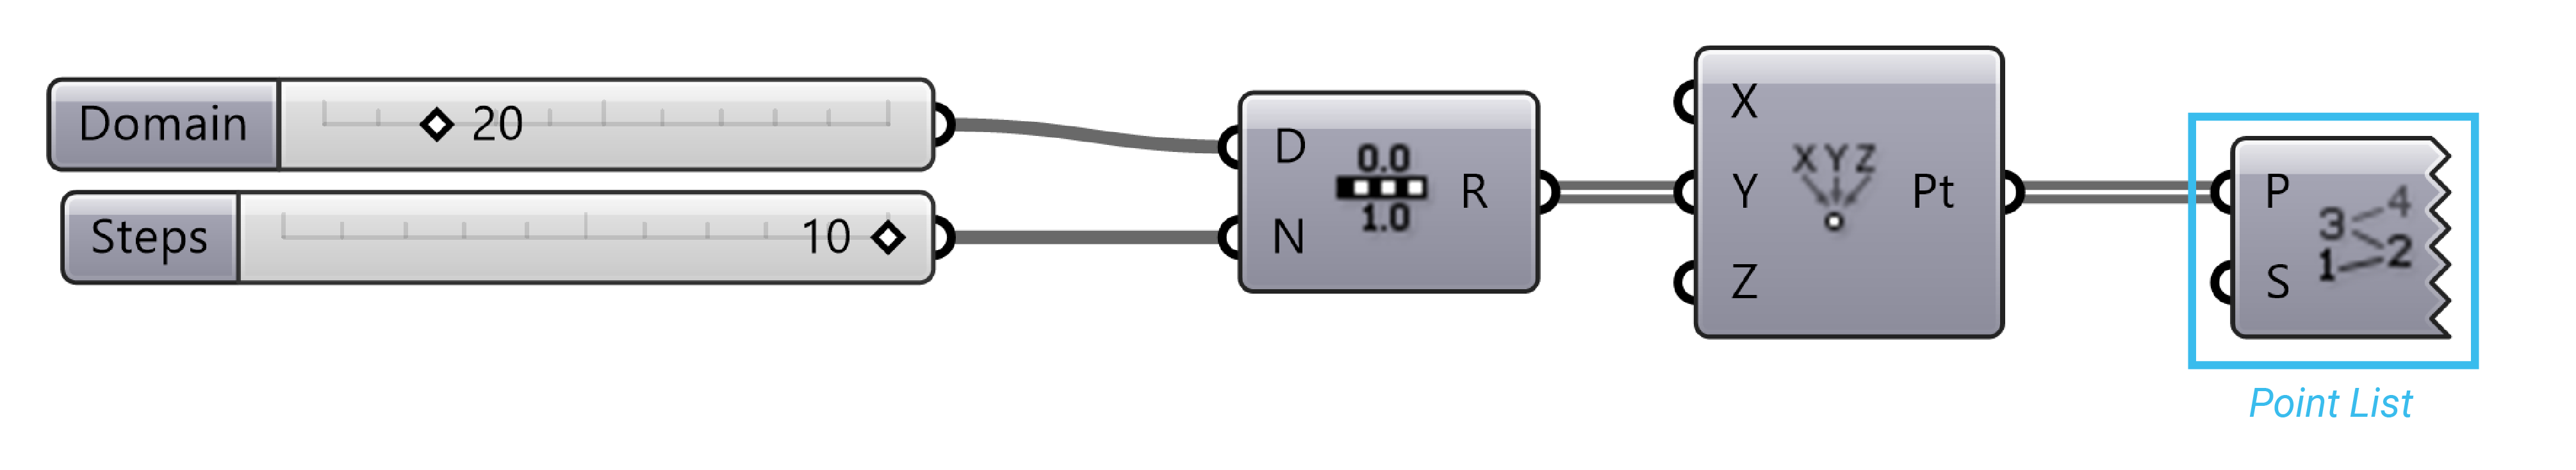
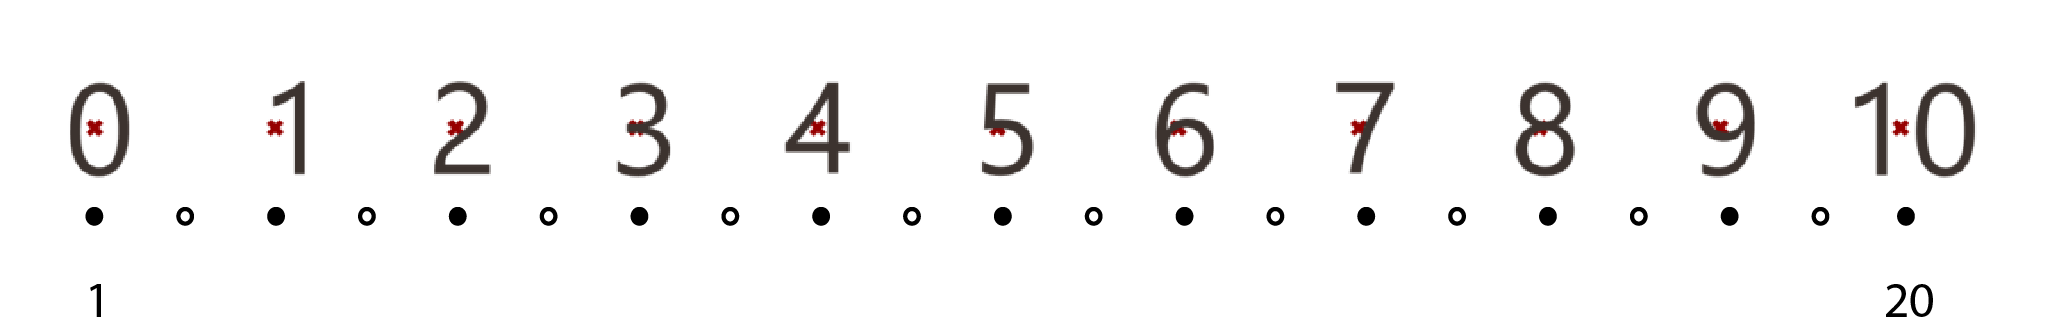
Range
list of evenly spaced numbers between a low and a high value called the Domain. A domain is every possible number between two numeric extremes.
A Range component divides a numeric domain into even segments and returns a list of values.

List visualization
There are several ways to visualize lists that can help to understand and manipulate data.
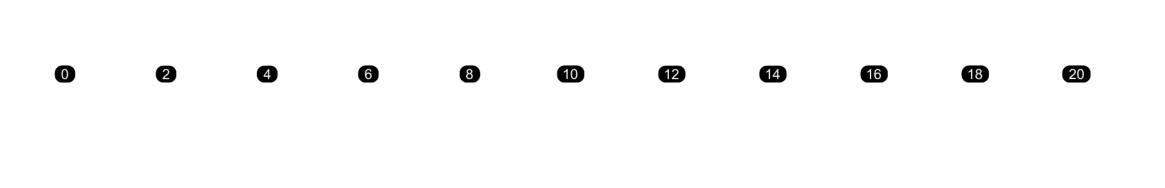
Point list
Point list component places the index item number next to the point geometry in the viewport.
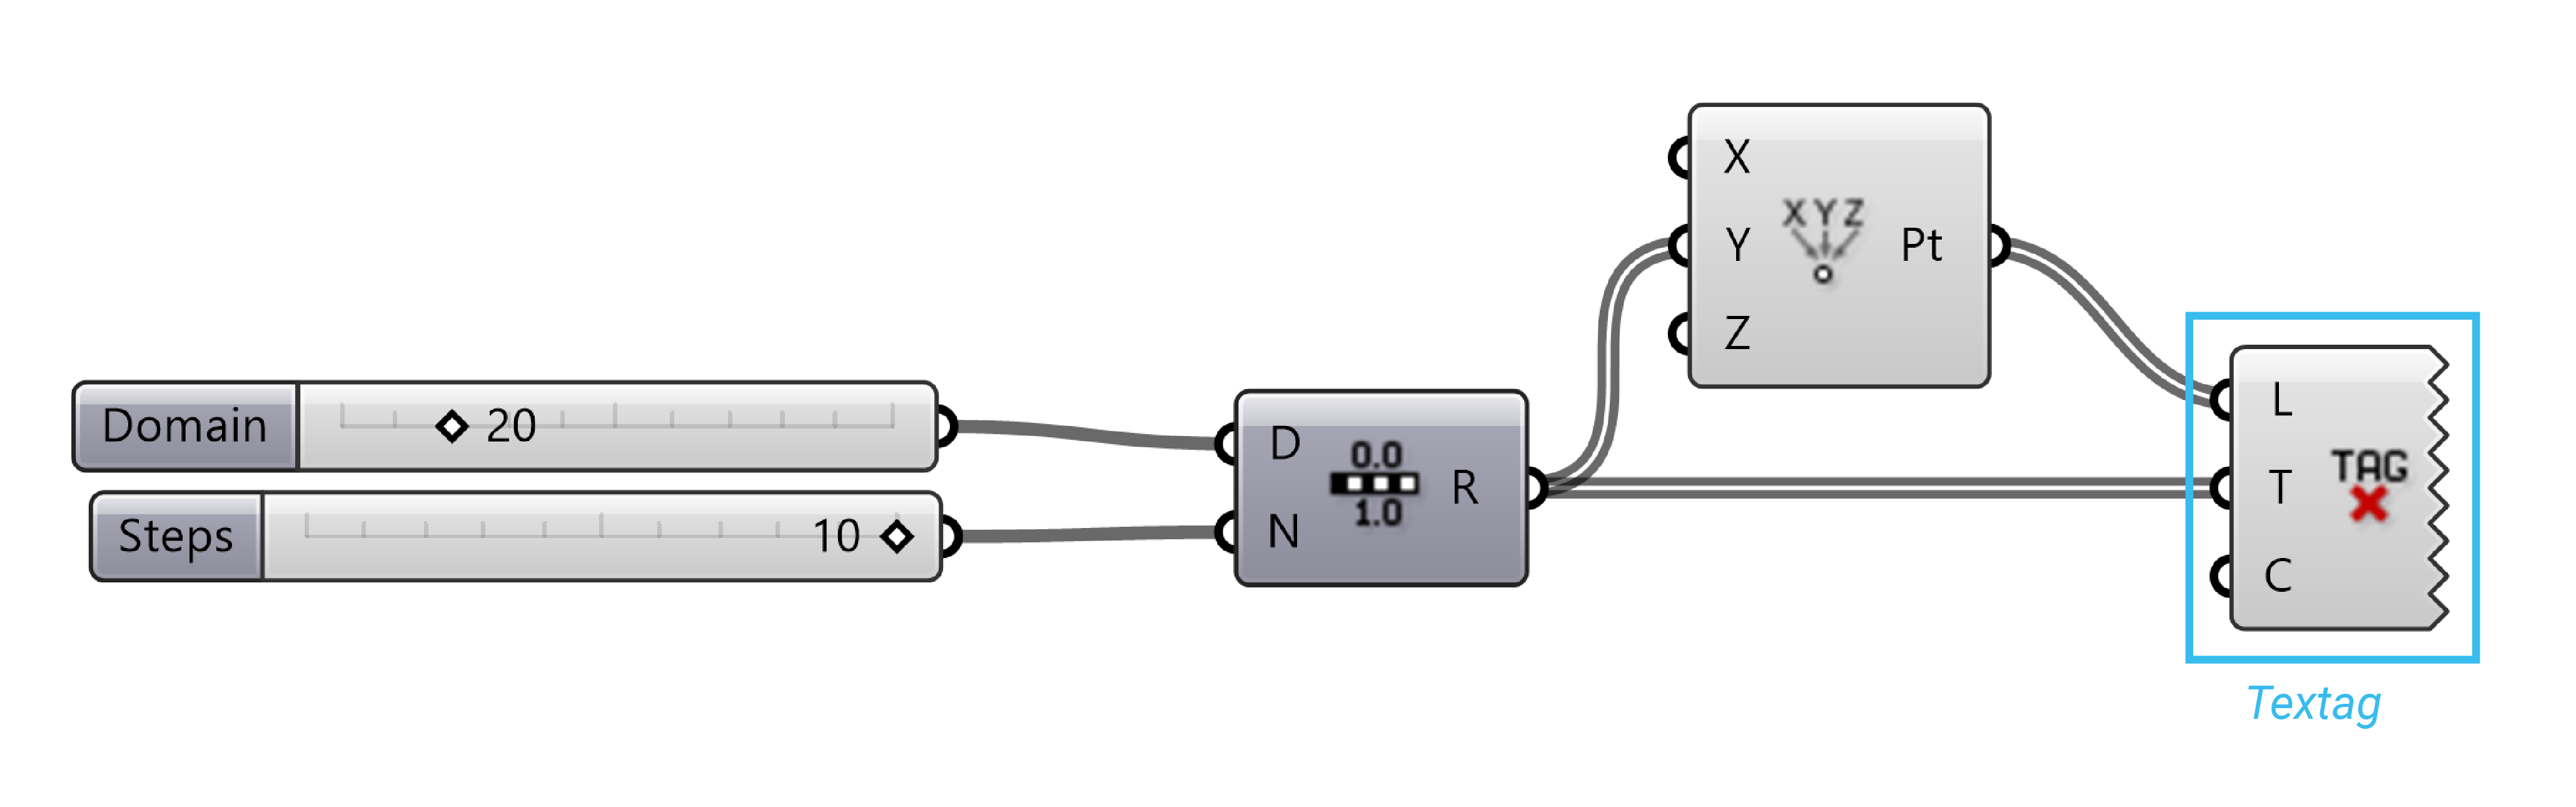
Text Tag
Allows you to draw strings in the viewport as feedback items. When text tags are baked into the scene, they turn into Text Dots.
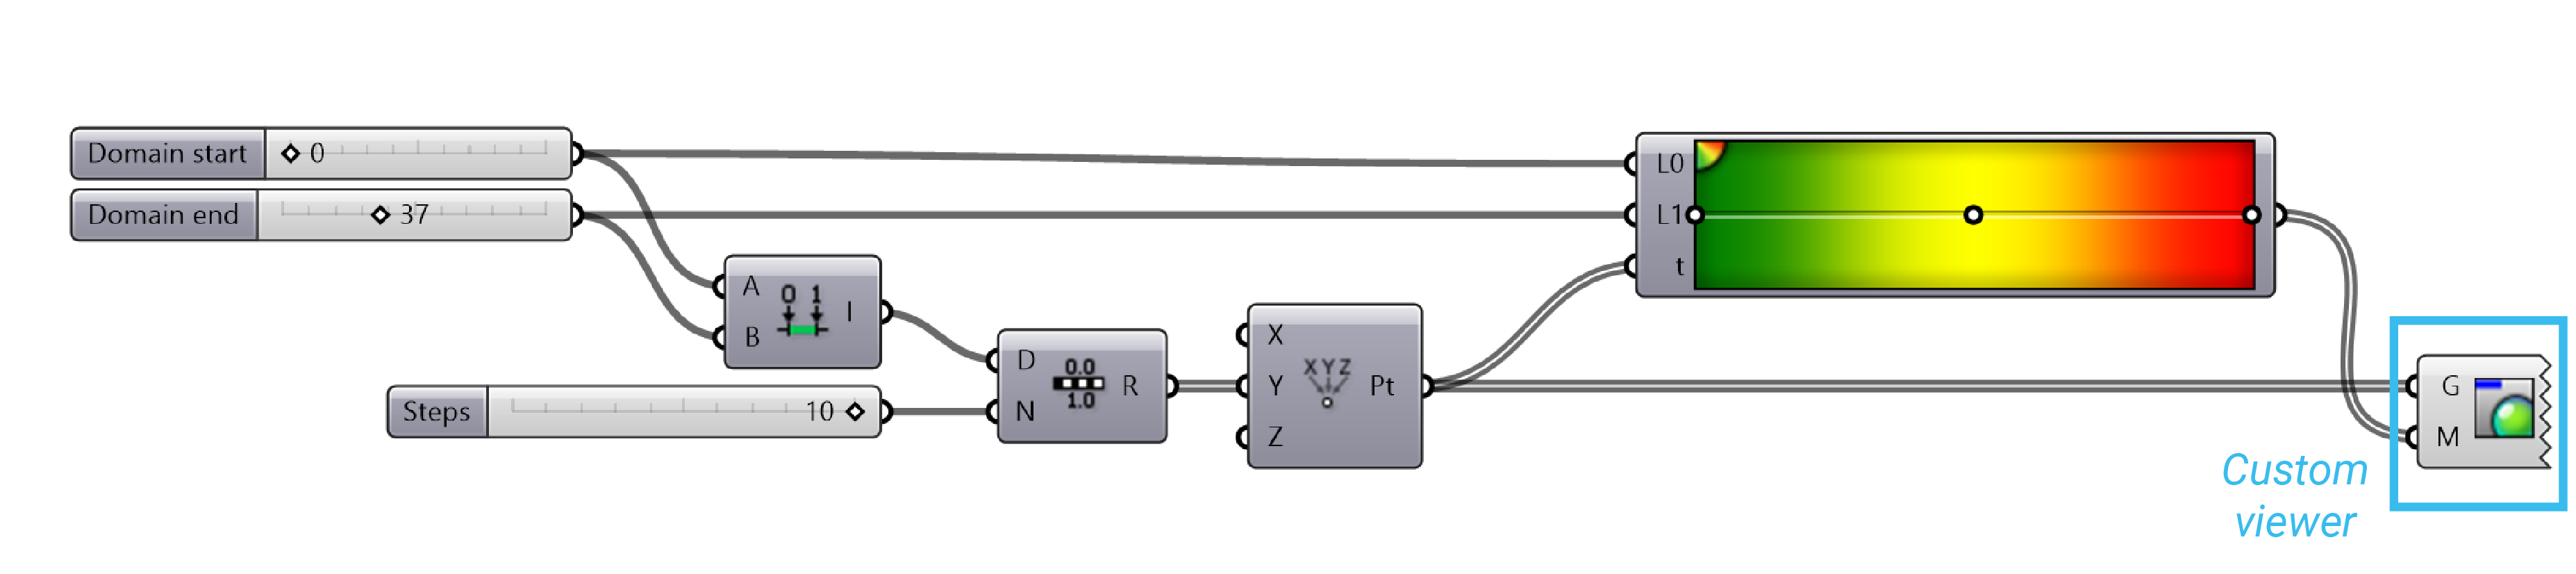
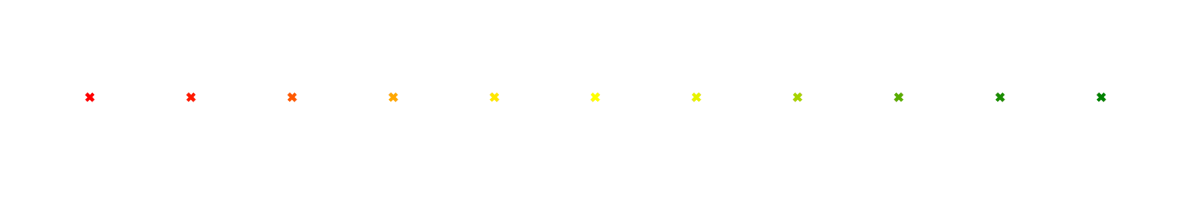
Color
We can visualize the list data by assigning color to the geometry. The L0 value represents the low end (left side) of the gradient, whereas the L1 value represents the upper end (right side). These values correspond to the start and end of our domain. The t-values are the elements in the list that will get mapped somewhere within the L0 and L1 range. The output of the gradient is a list of RGB color values which correspond to each point in our list.
List operations
The strength of Grasshopper is to quickly build and manipulate lists of data. We can store different types of data in a list (numbers, points, vectors, curves, surfaces, breps, etc…)
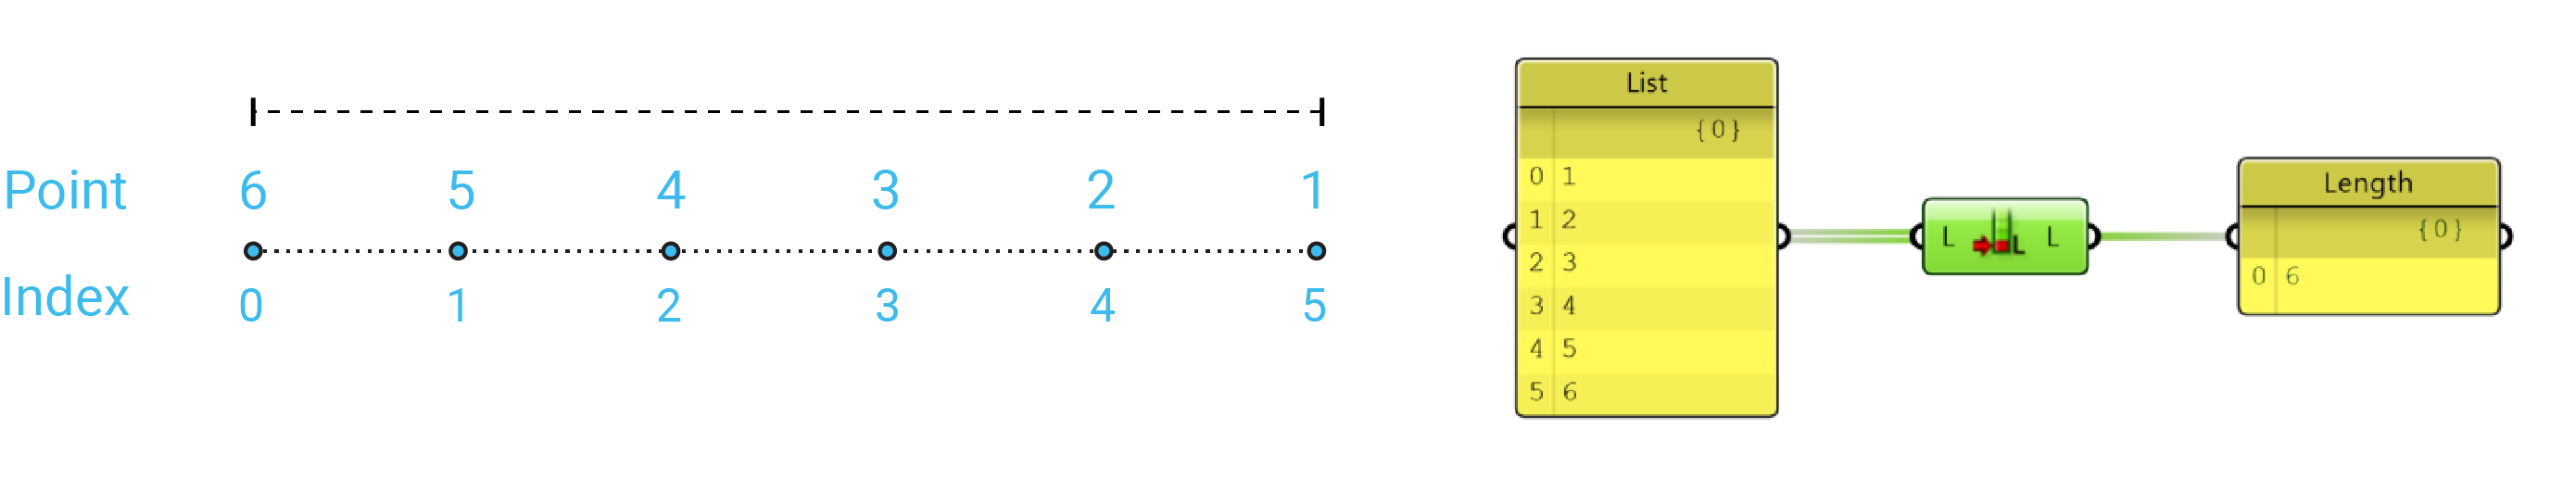
List length
Measures the length of the List. Because our lists always start at zero, the highest possible index in a list equals the length of the list minus one.
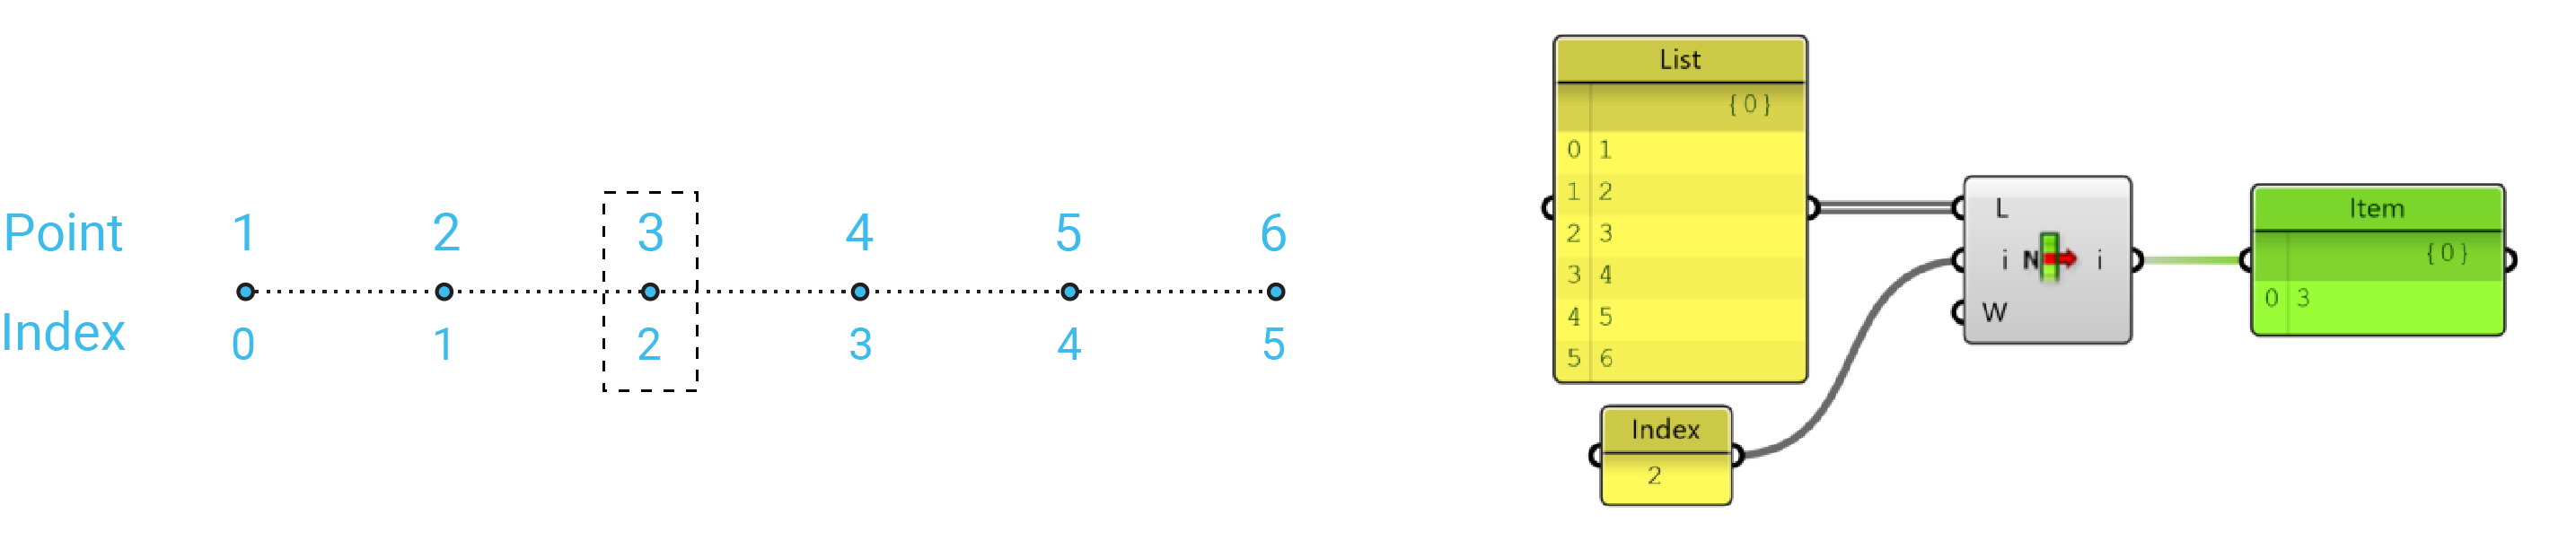
List item
To find a specific data item from within a data set. When accessing individual items in a list, we have to specify the index number we would like to access. We can feed a single integer or a list of integers.
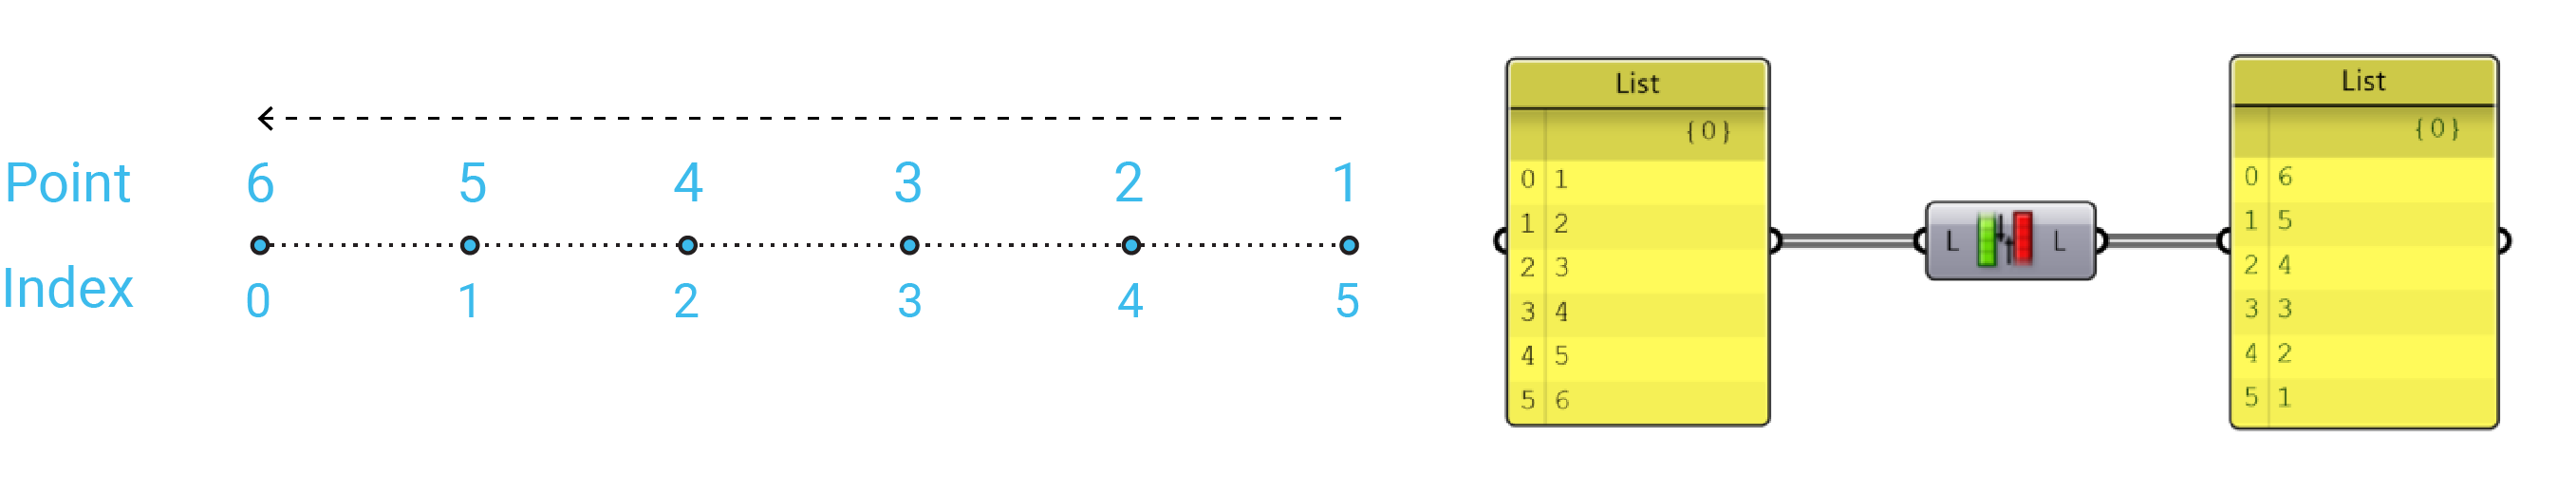
Reverse list
To invert the order of the list.
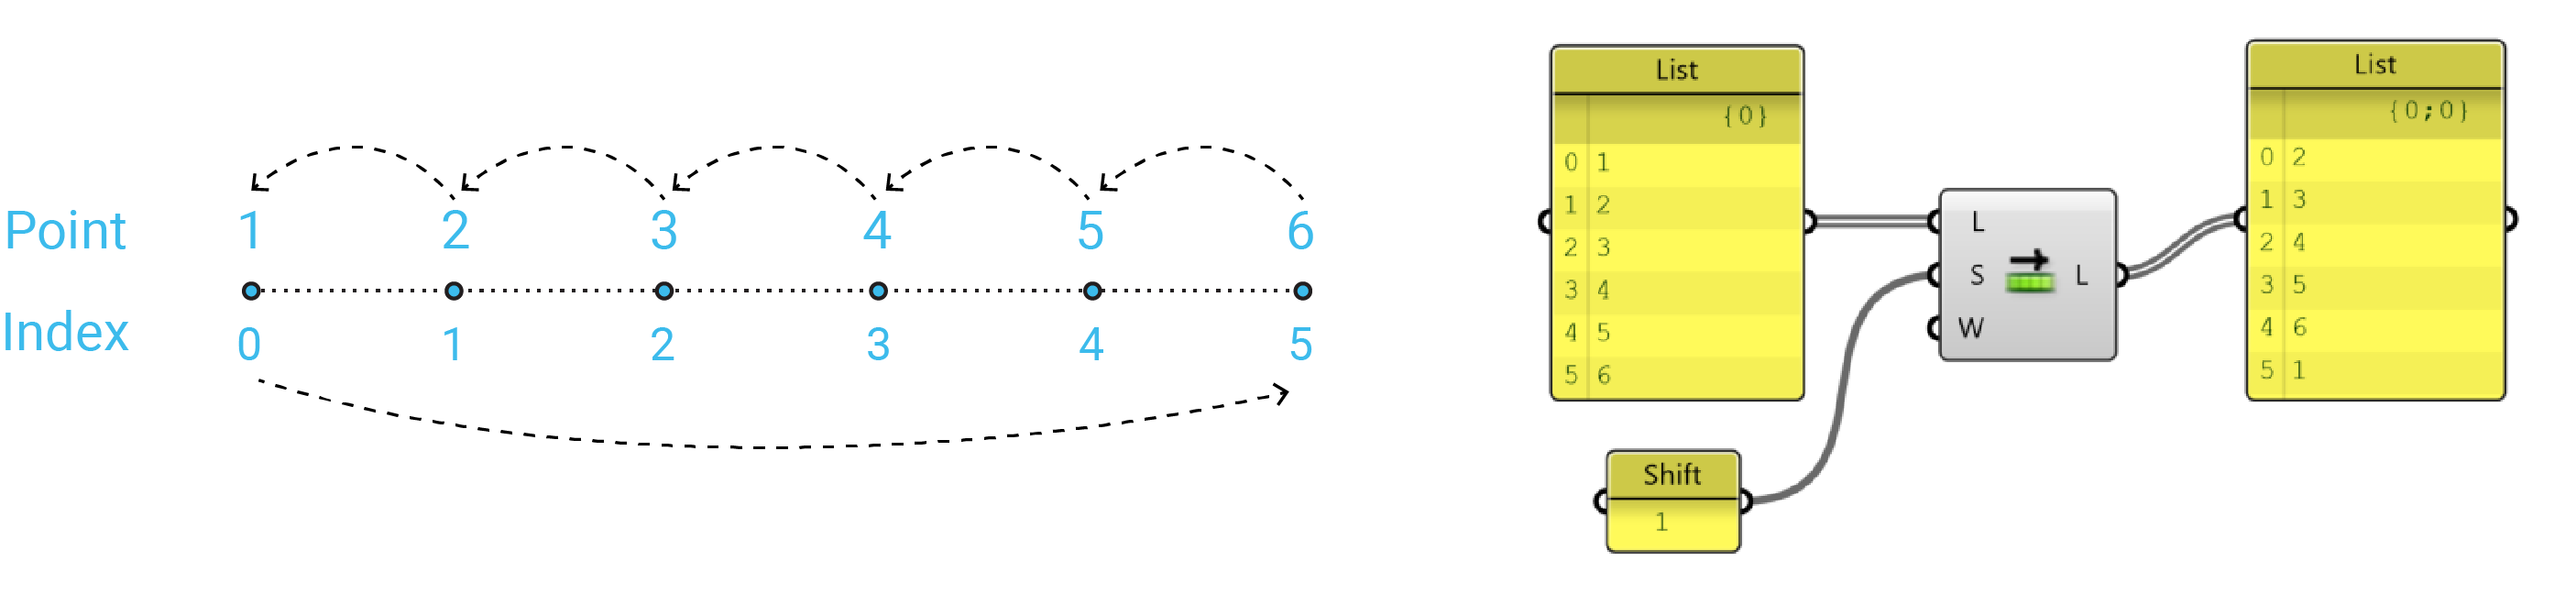
Shift list
To move the list up or down a number of increments depending on the value of the shift offset. If we set the Wrap value to False, we will remove this value. However, if we set the wrap value to True, the first entry will be moved to the bottom of the list.
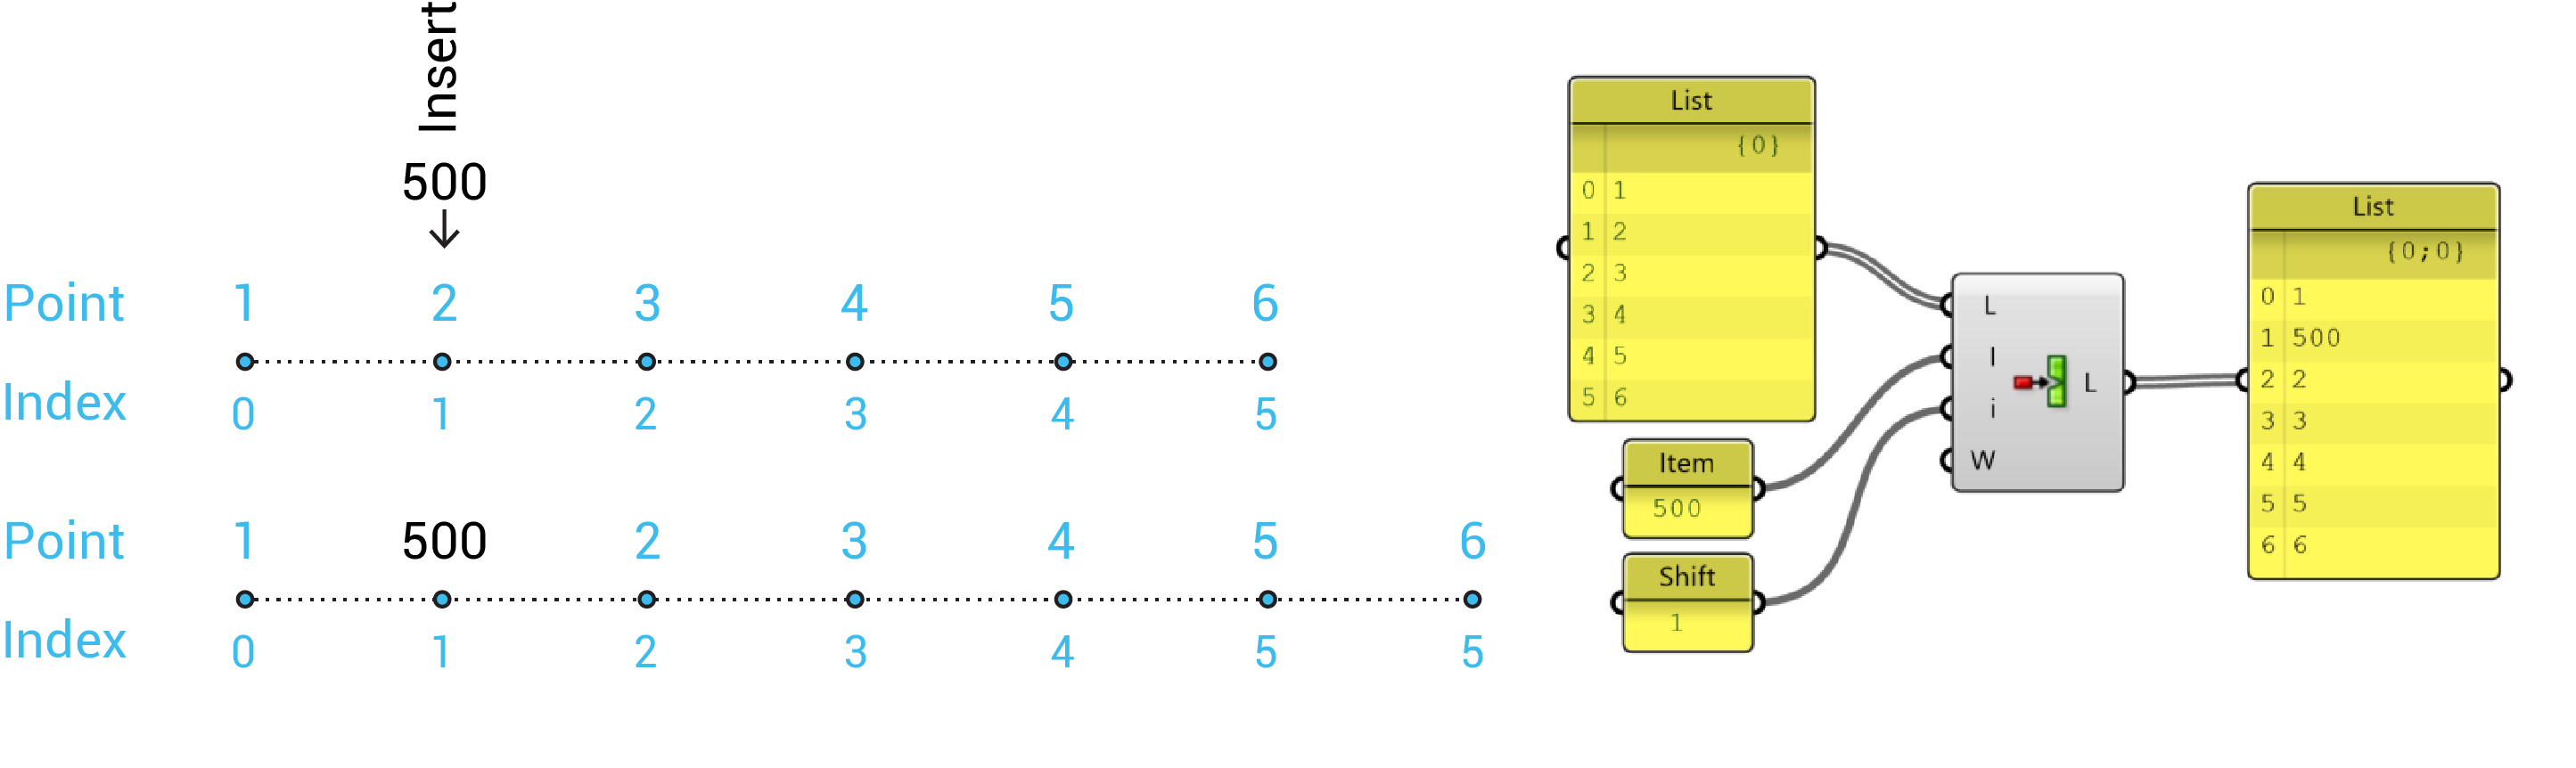
Insert item
Insert a collection of items into a list. You need to know the items you want to insert and the index position.
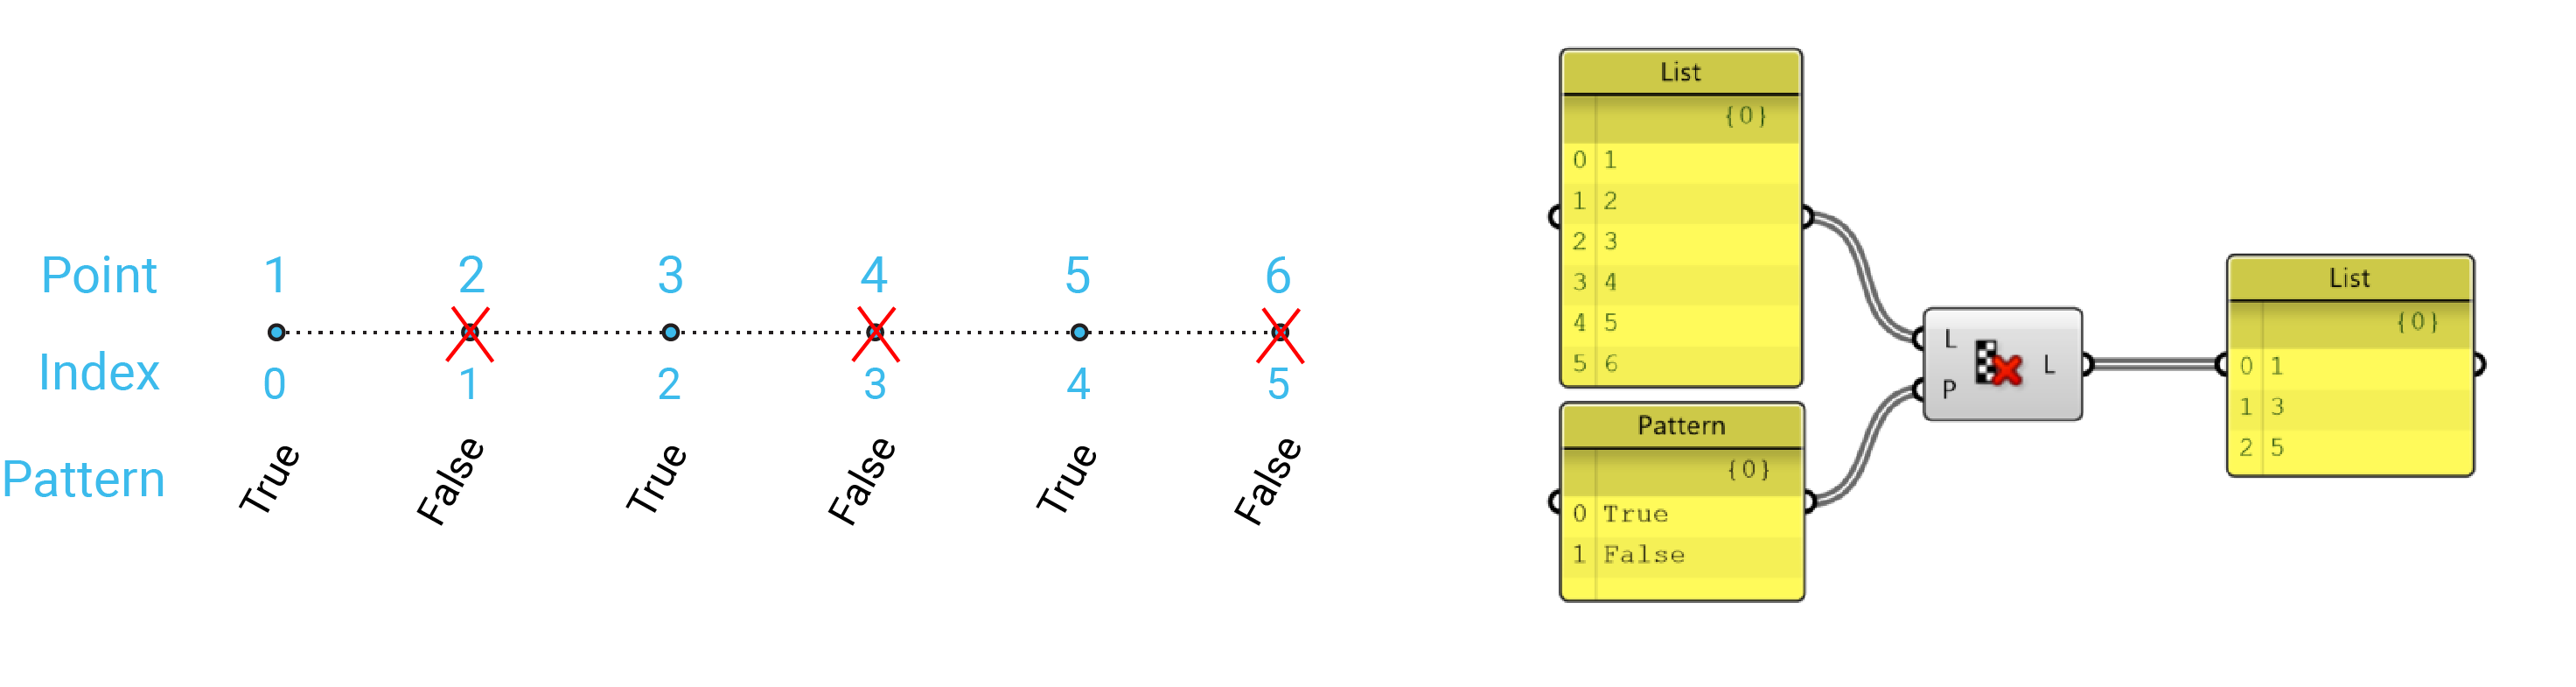
Cull pattern
Removes elements in a list using a pattern. The pattern is defined as a list of Boolean (true or false) values.
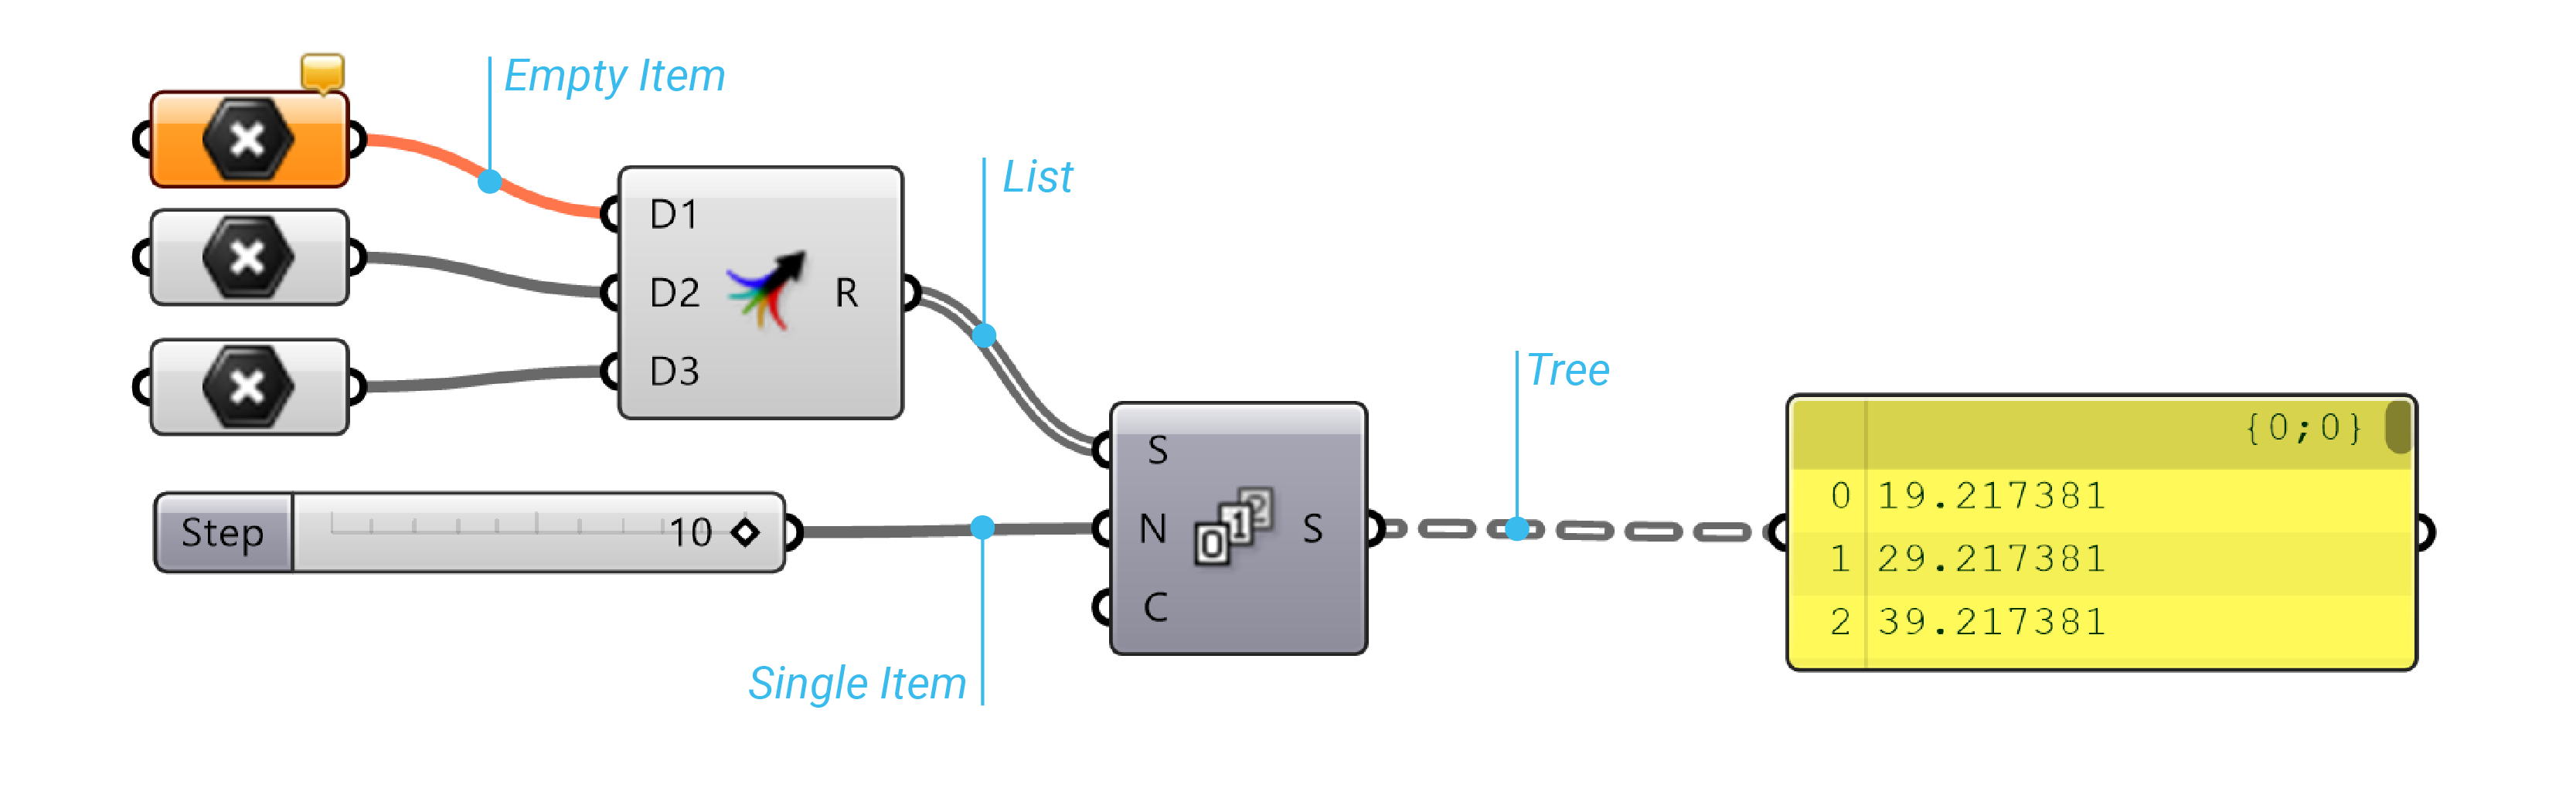
Data trees
Data structure
We can subdivide data structure into 3 different groups:
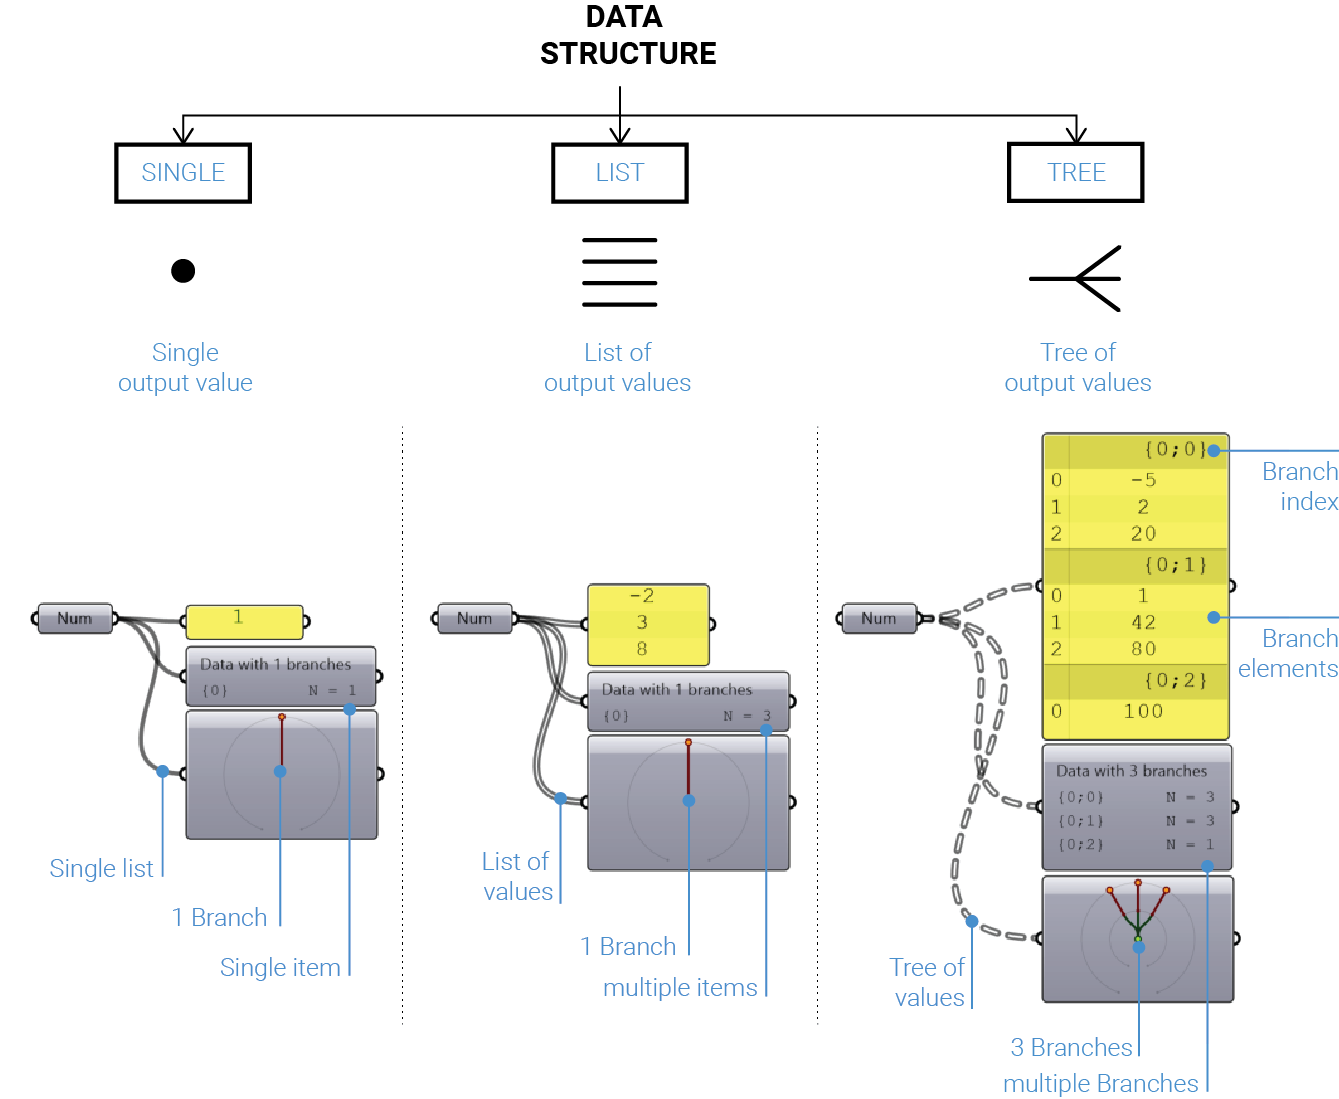
Single
Many components operates on individual values and also output individual values as result:
List
Other category of components create lists of data from single input values:
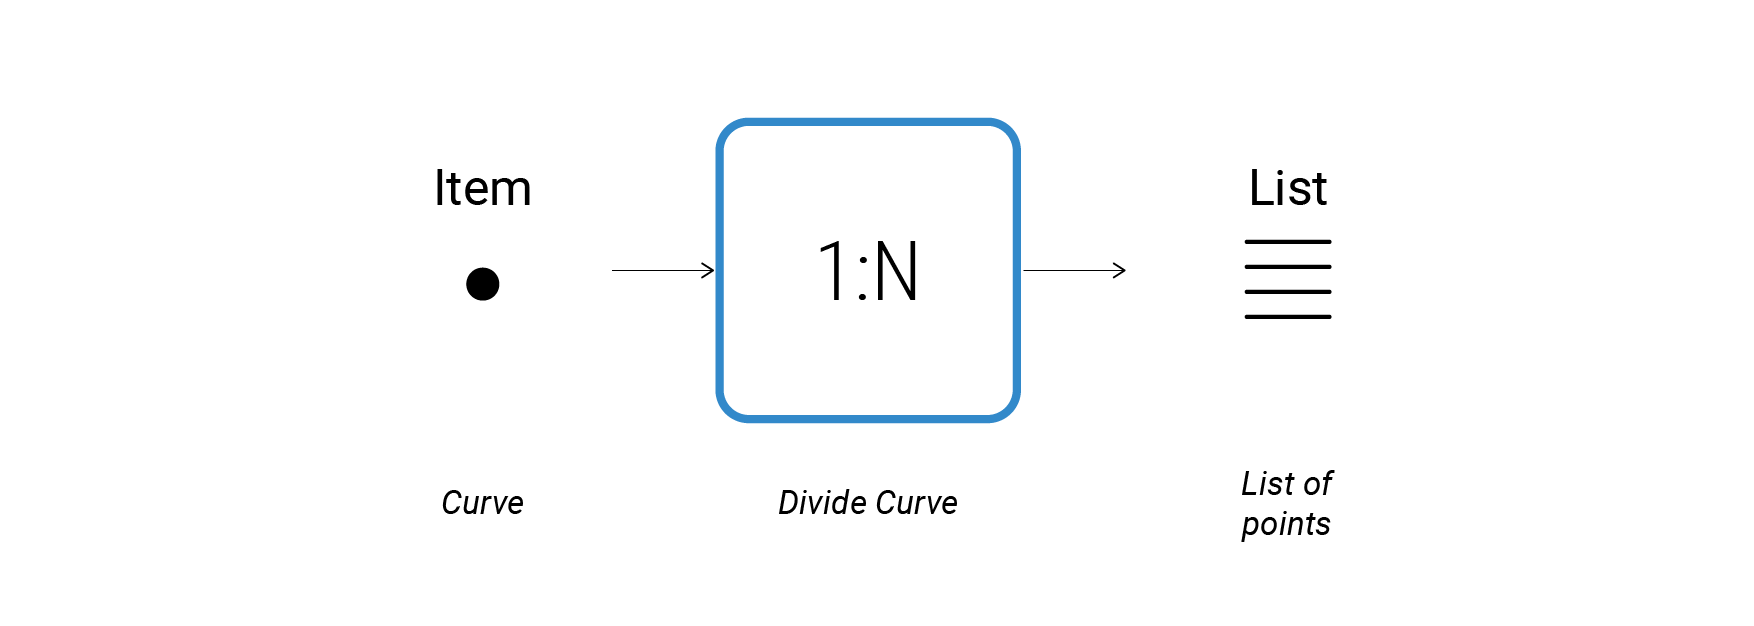
occurring also the opposite behavior:
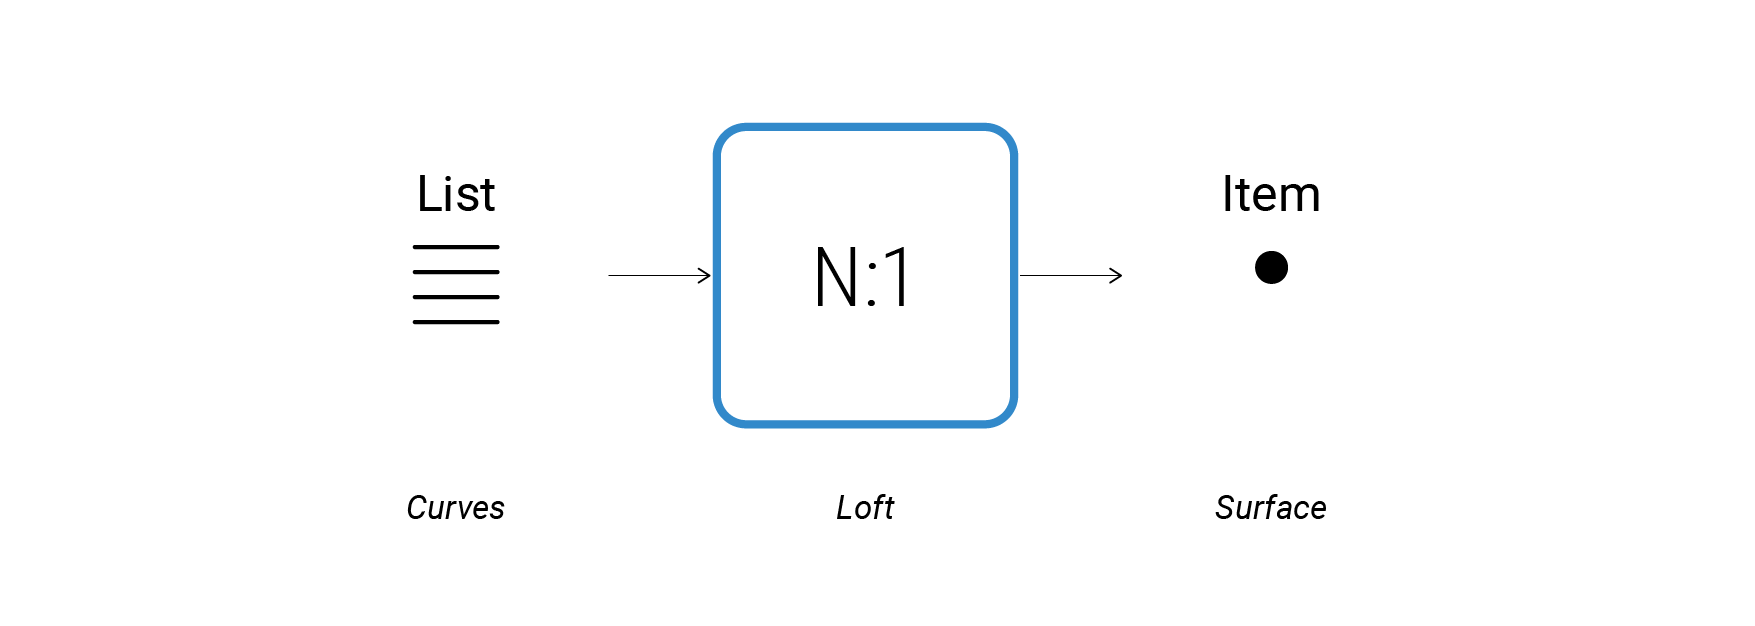
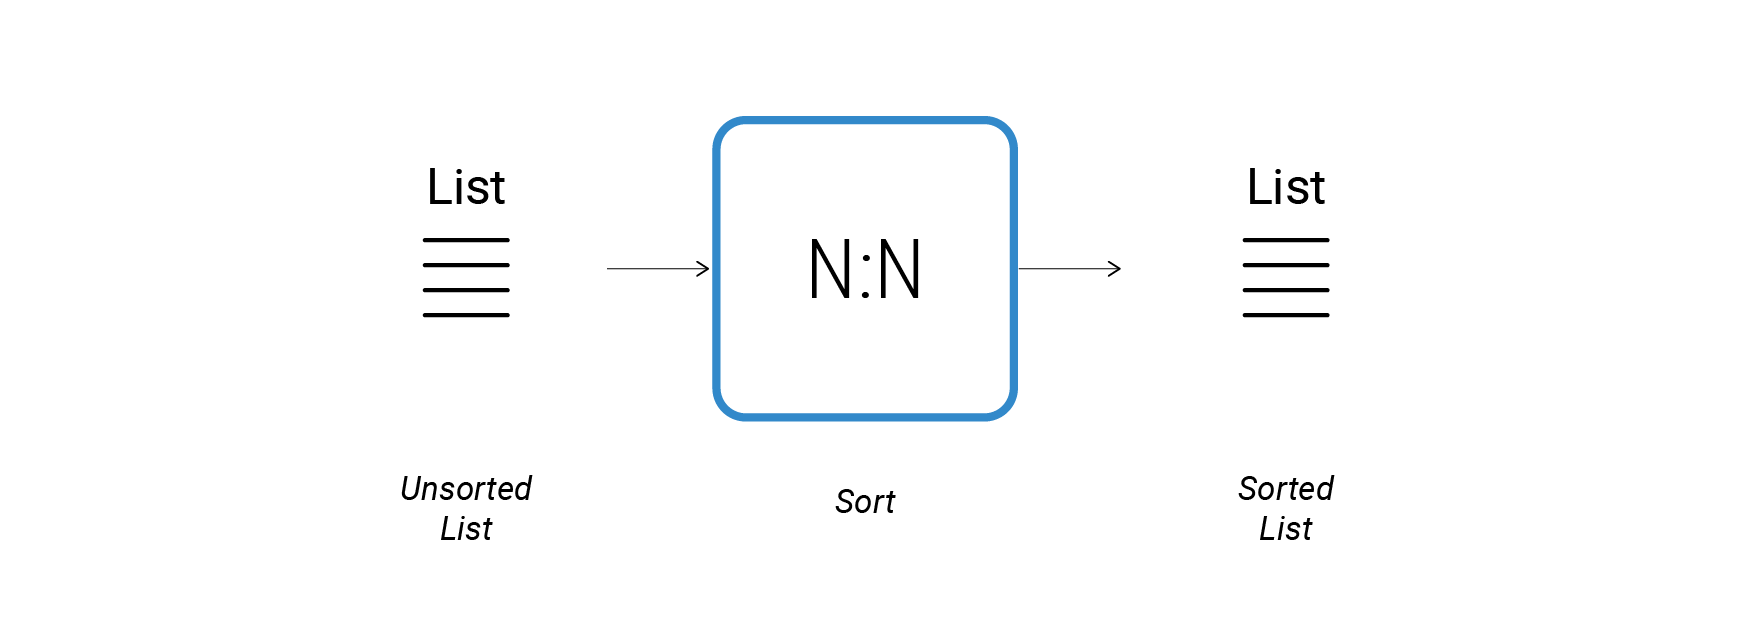
Many components only operates on lists of data and also output list of data:
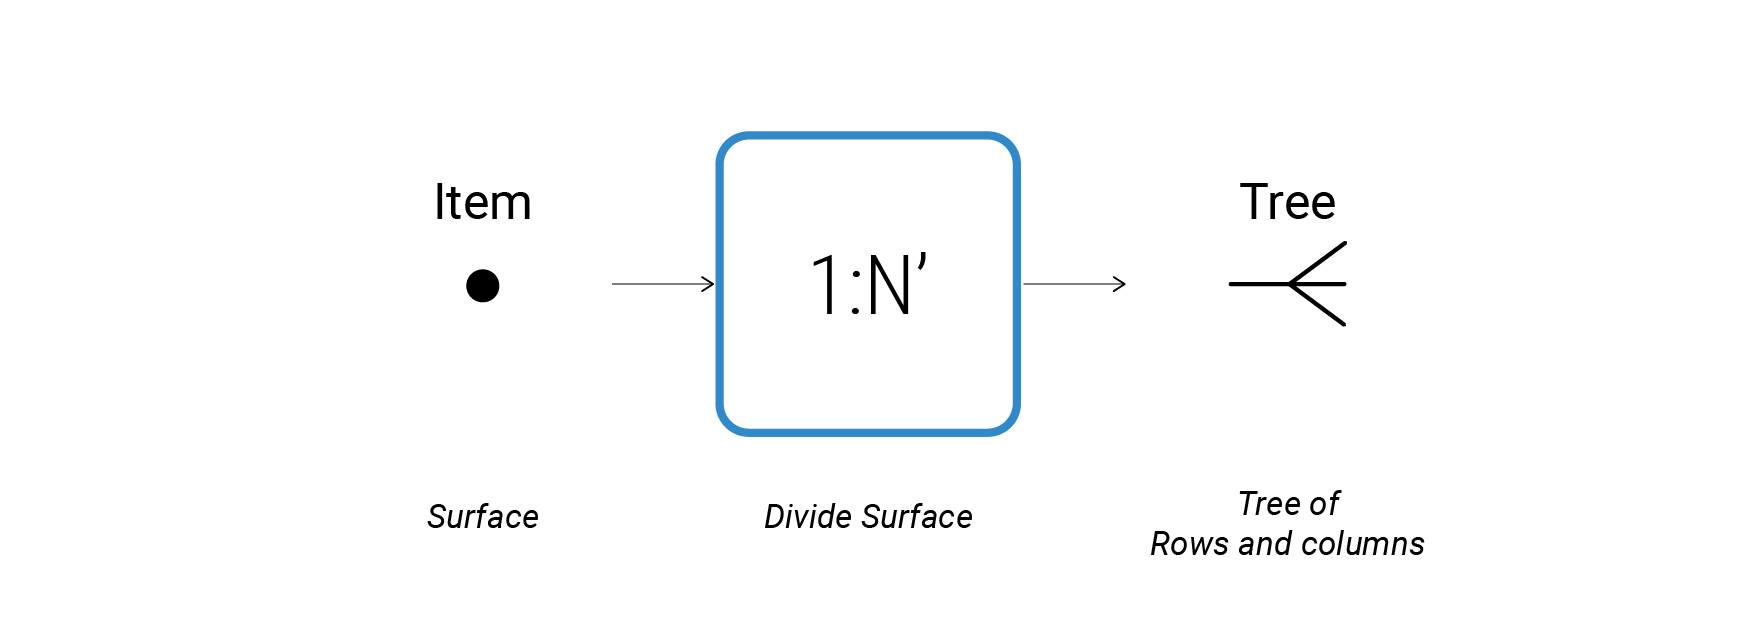
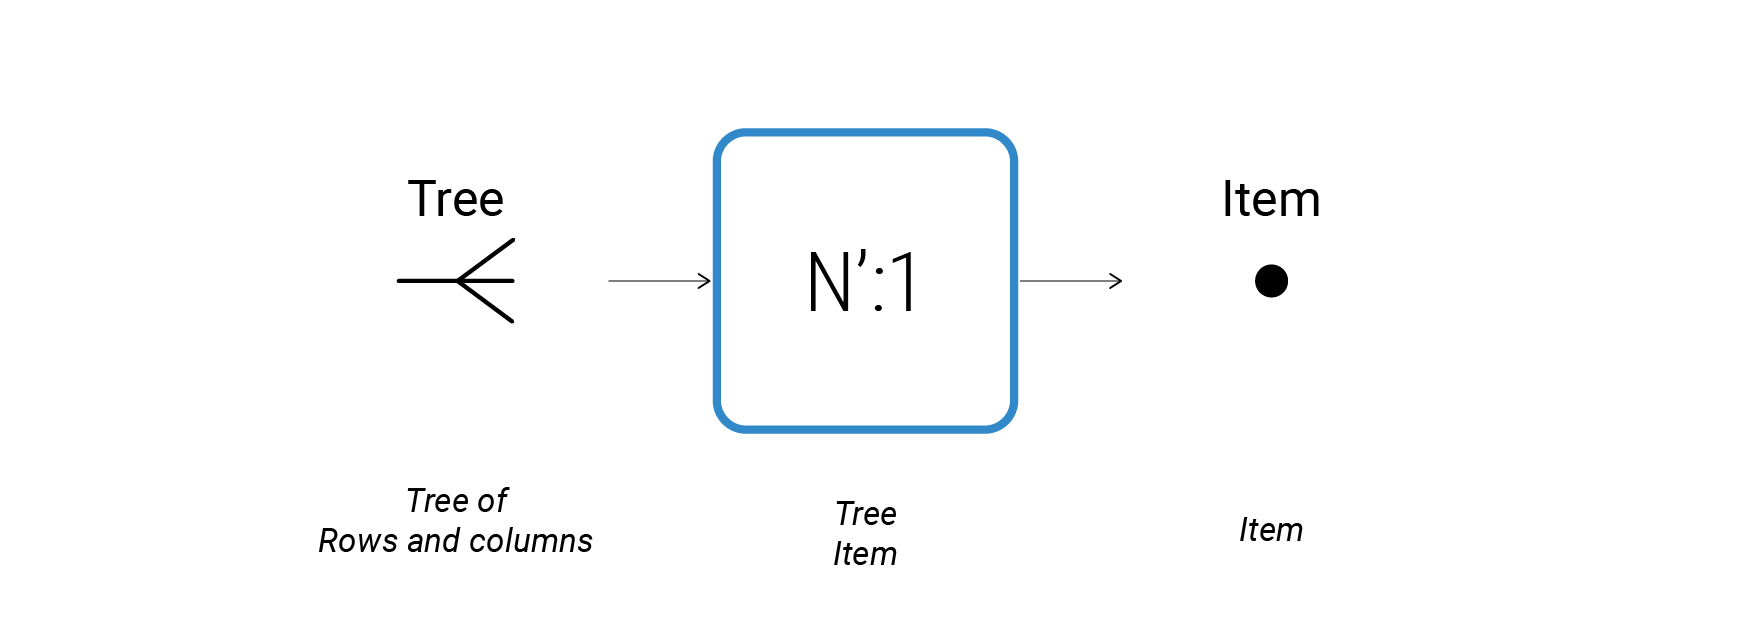
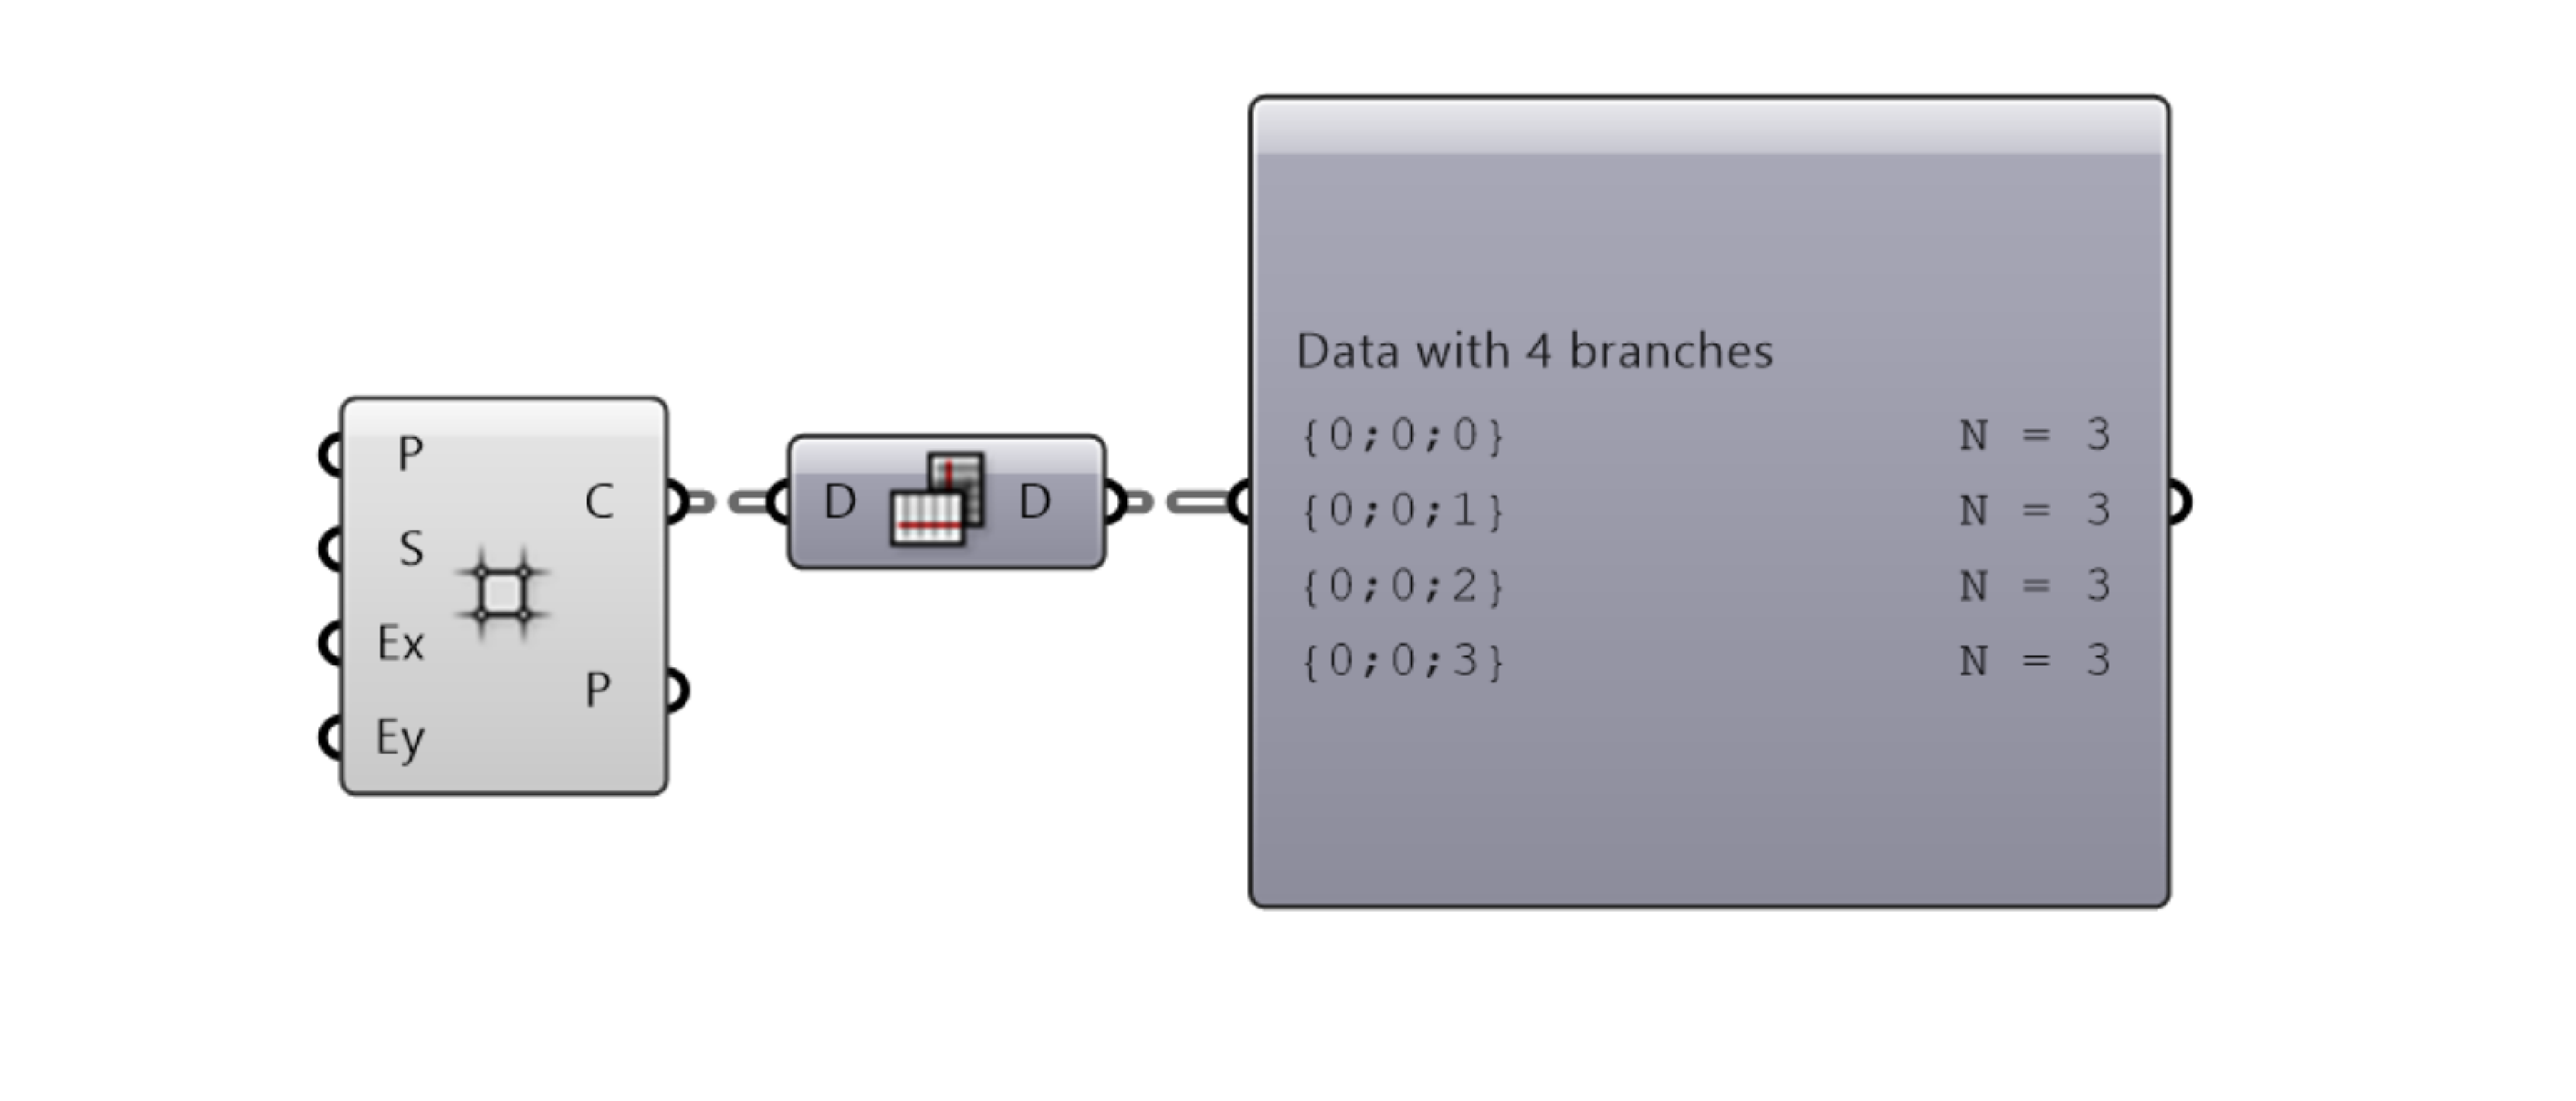
Tree
Some few components output several list of points, each of them representing a row or column in a grid:
we can also access to specific items in this data tree:
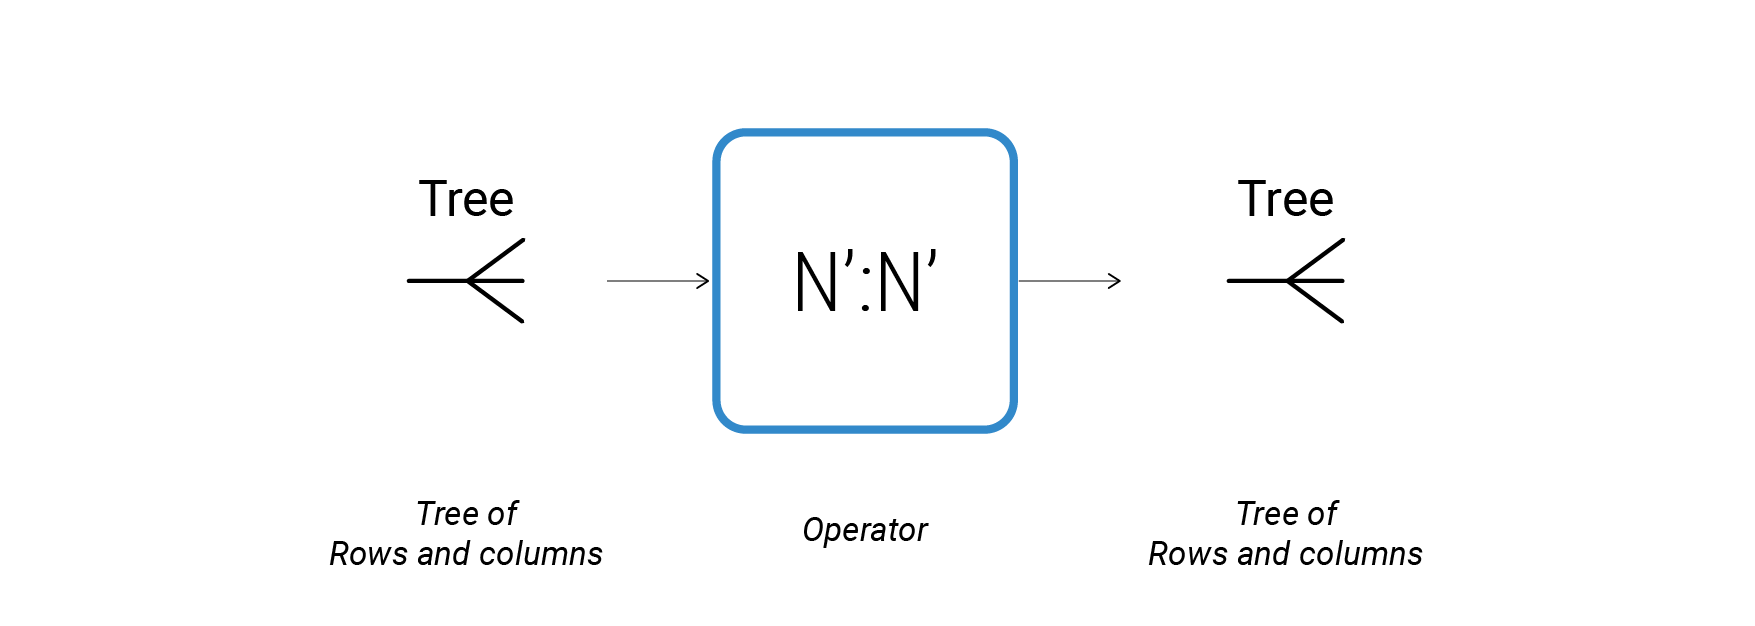
or we can just operate them keeping or modifying its data tree structure:
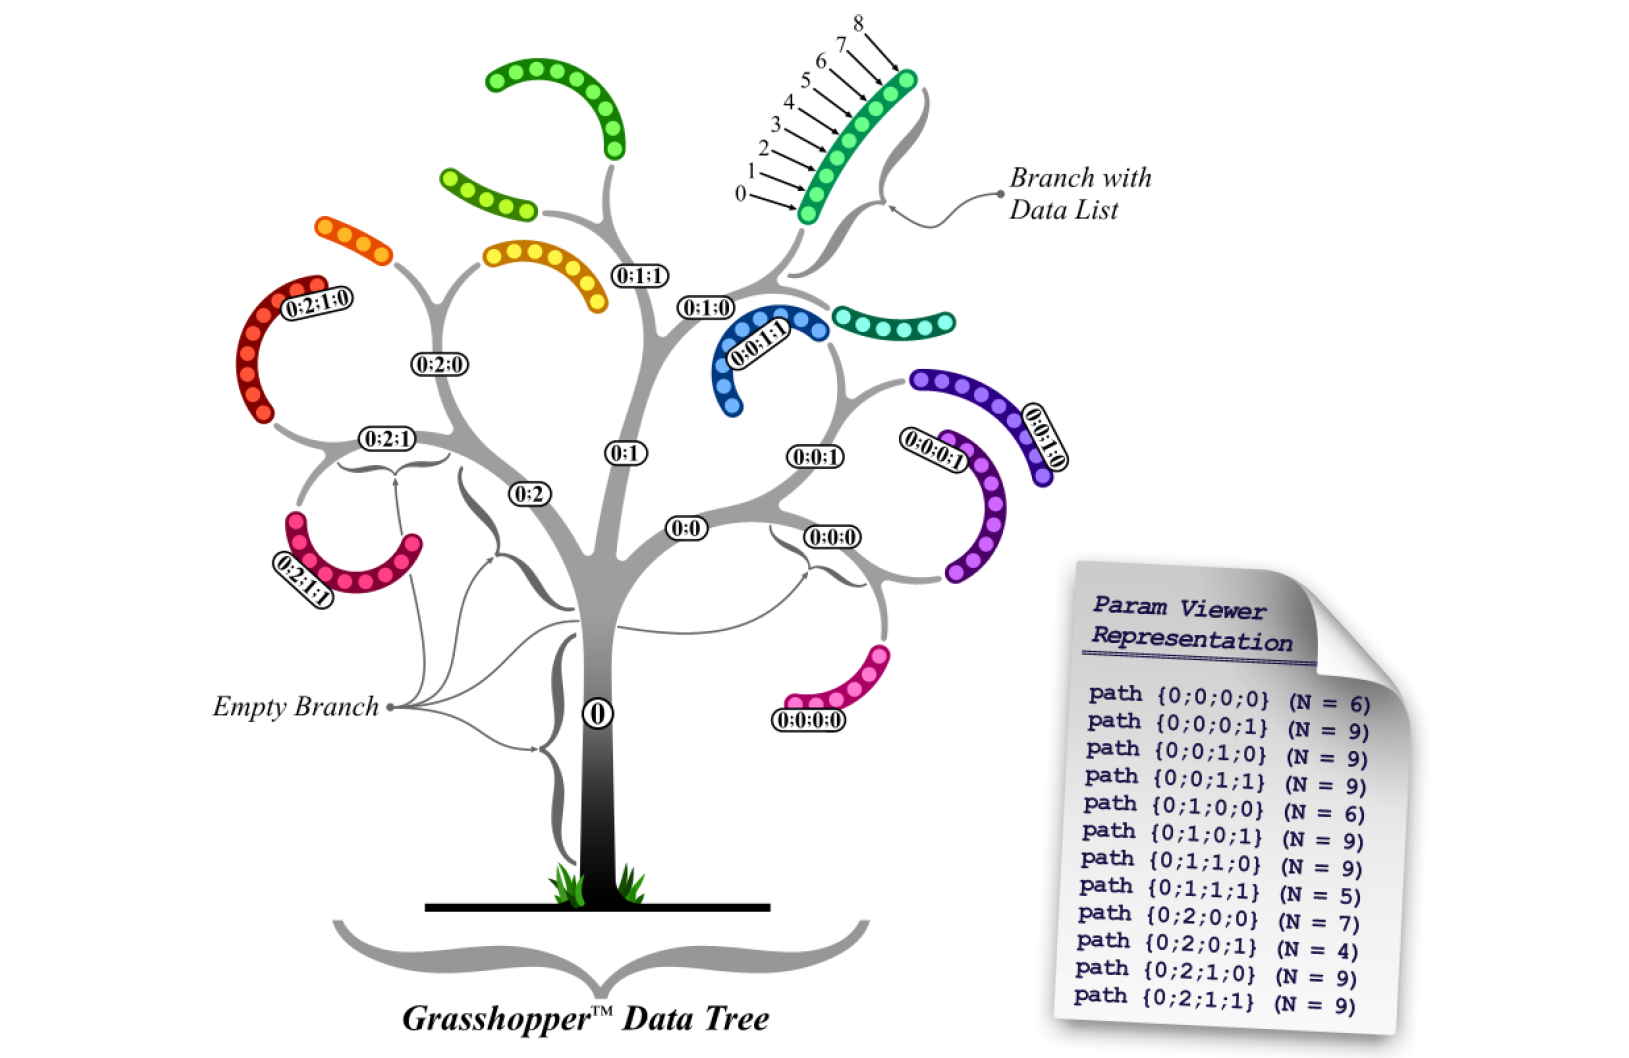
Data tree
It is important to understand how large quantities of data are stored, accessed, and manipulated.
A Data Tree is a hierarchical structure for storing data in nested lists or sub-lists.
These nested sub-lists work in the same way as folder structures on your computer in that accessing indexed items require moving through paths that are informed by their generation of parent lists and their own sub-index.
![]() A Data Tree is essentially a list of lists
A Data Tree is essentially a list of lists ![]()
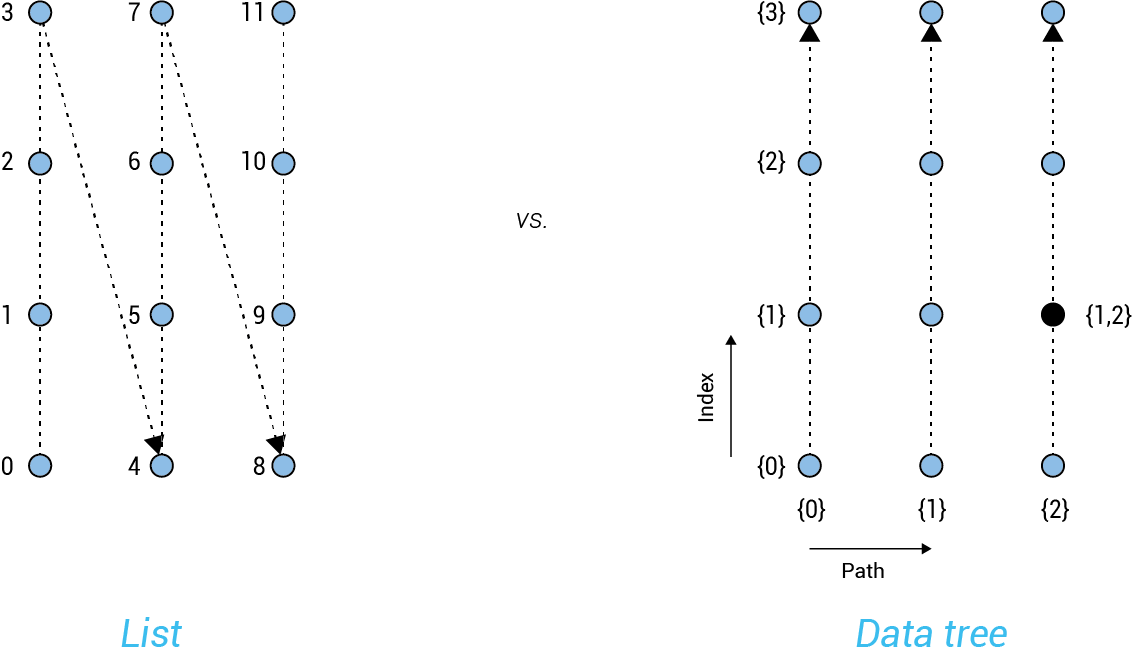
![]() Difference between list and data tree:
Difference between list and data tree:
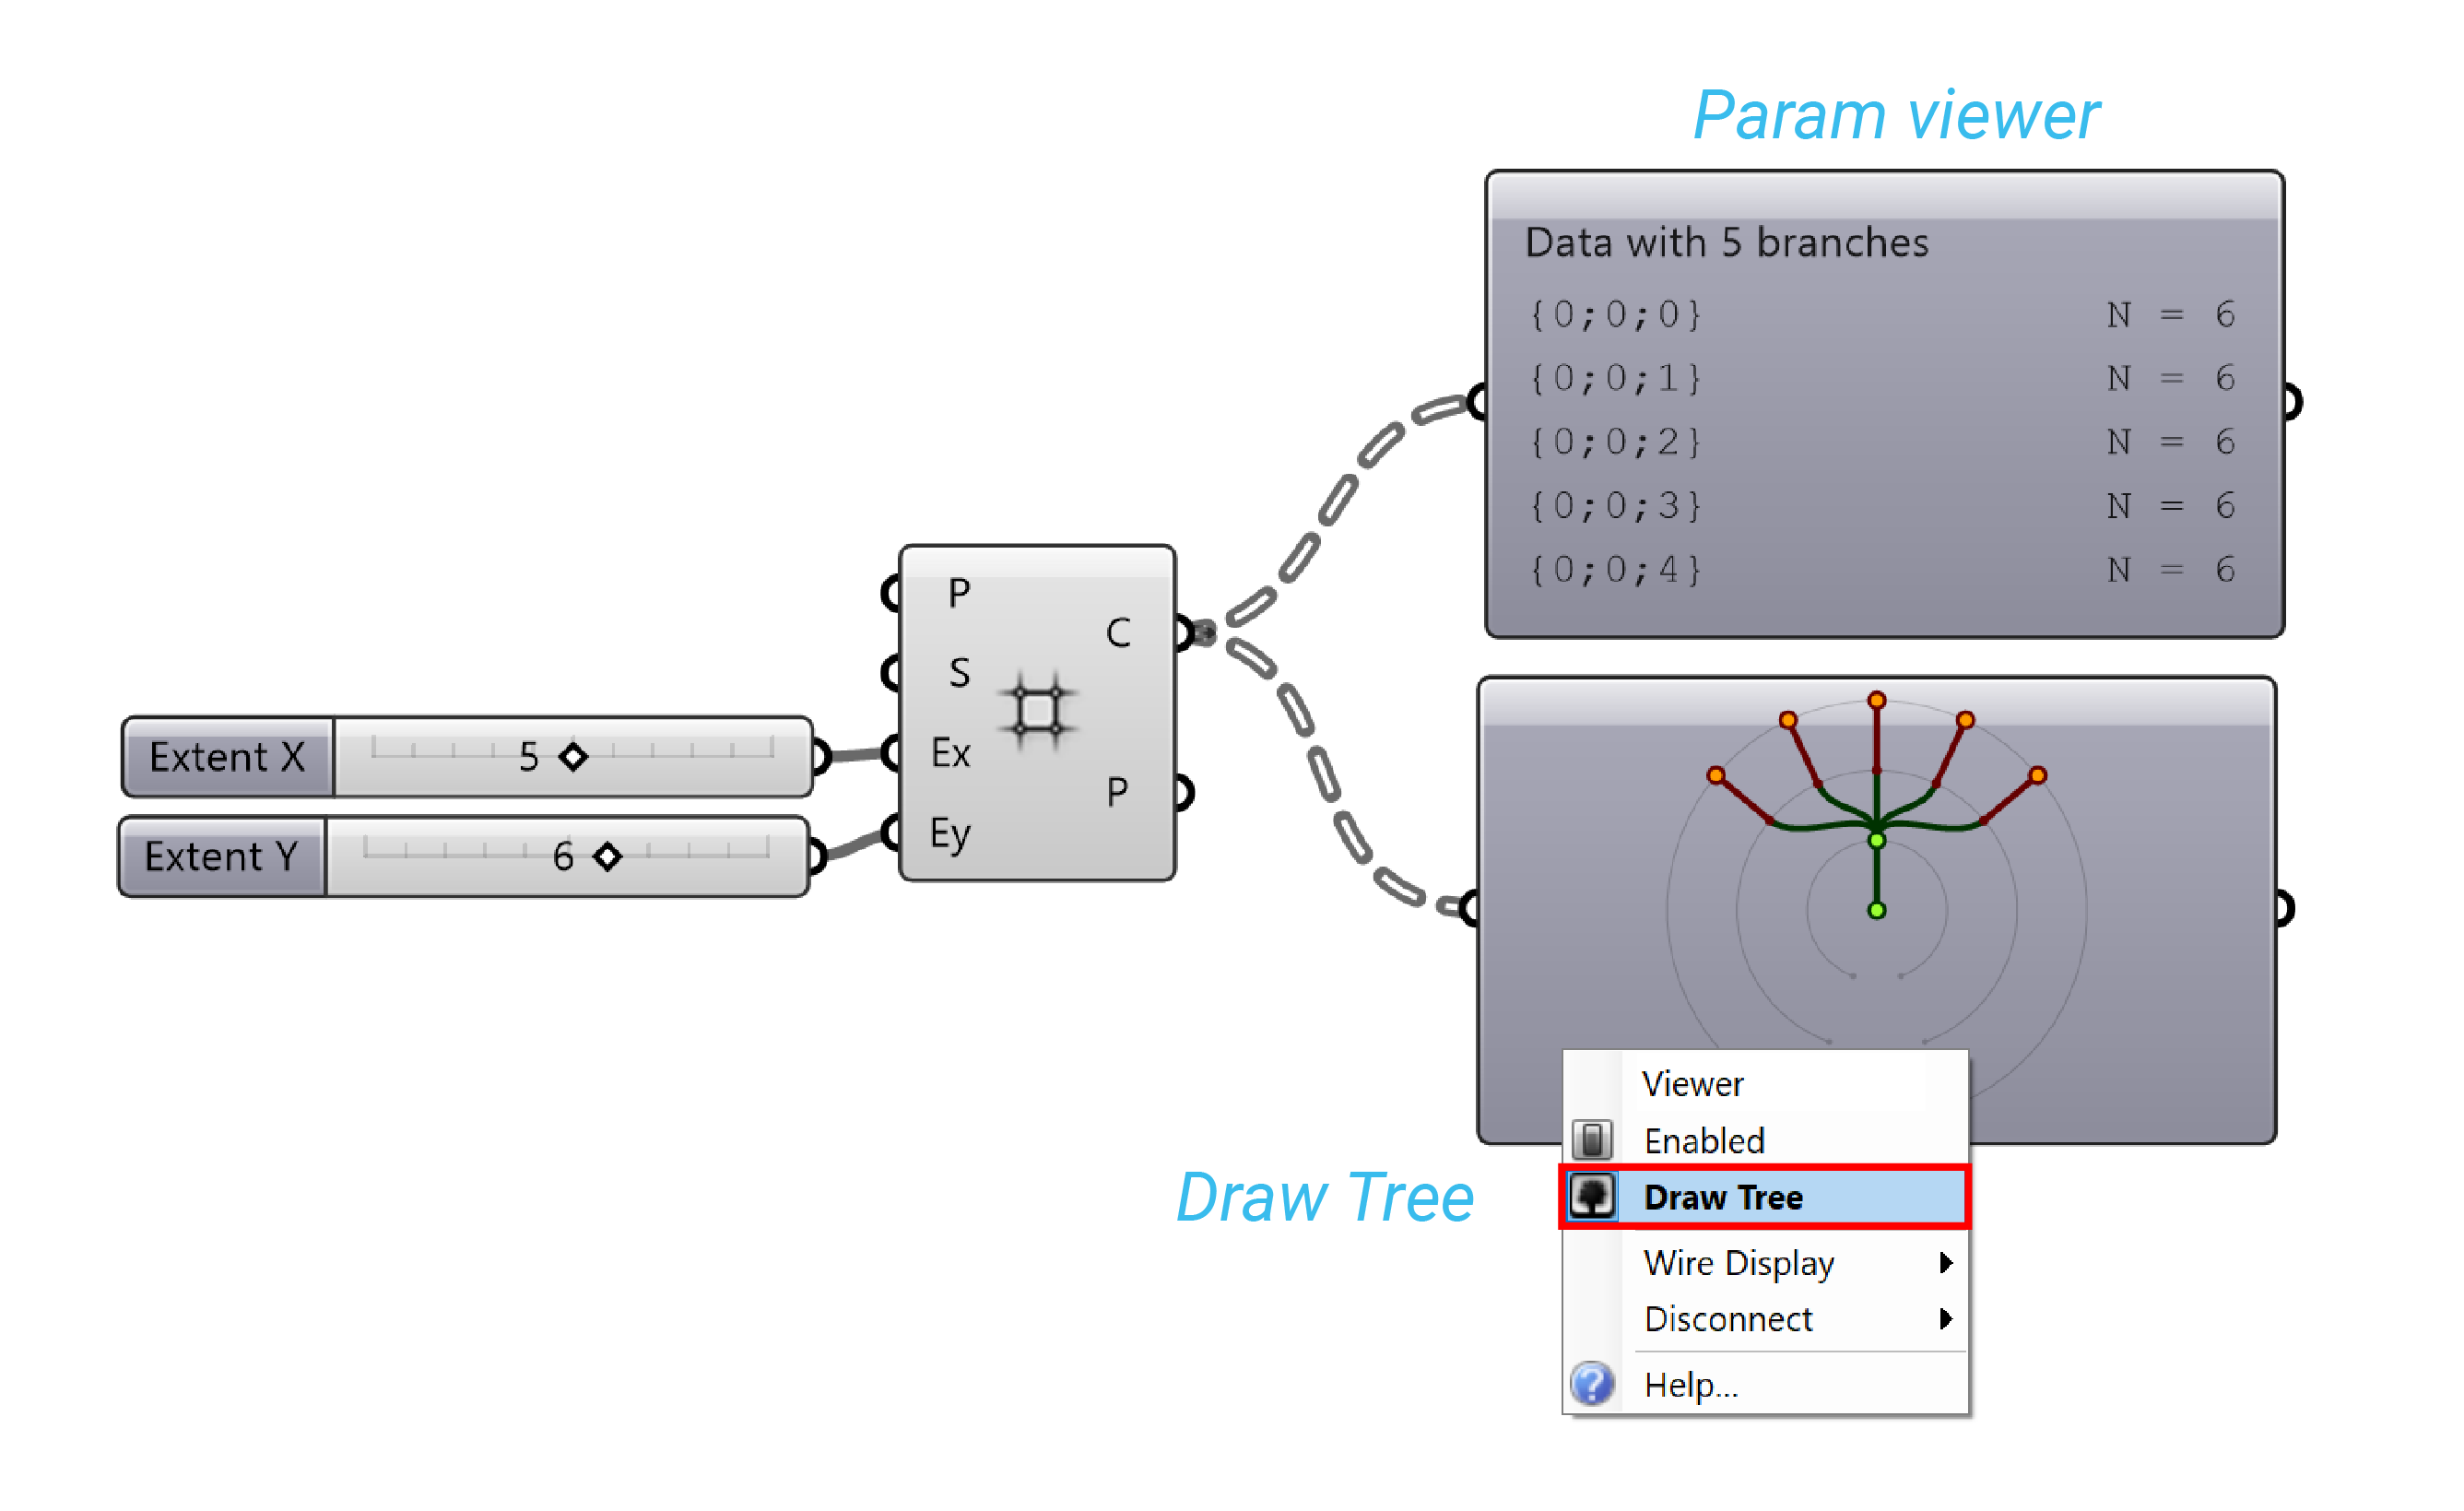
Tree visualization
Param viewer (Params/Util/Param Viewer)
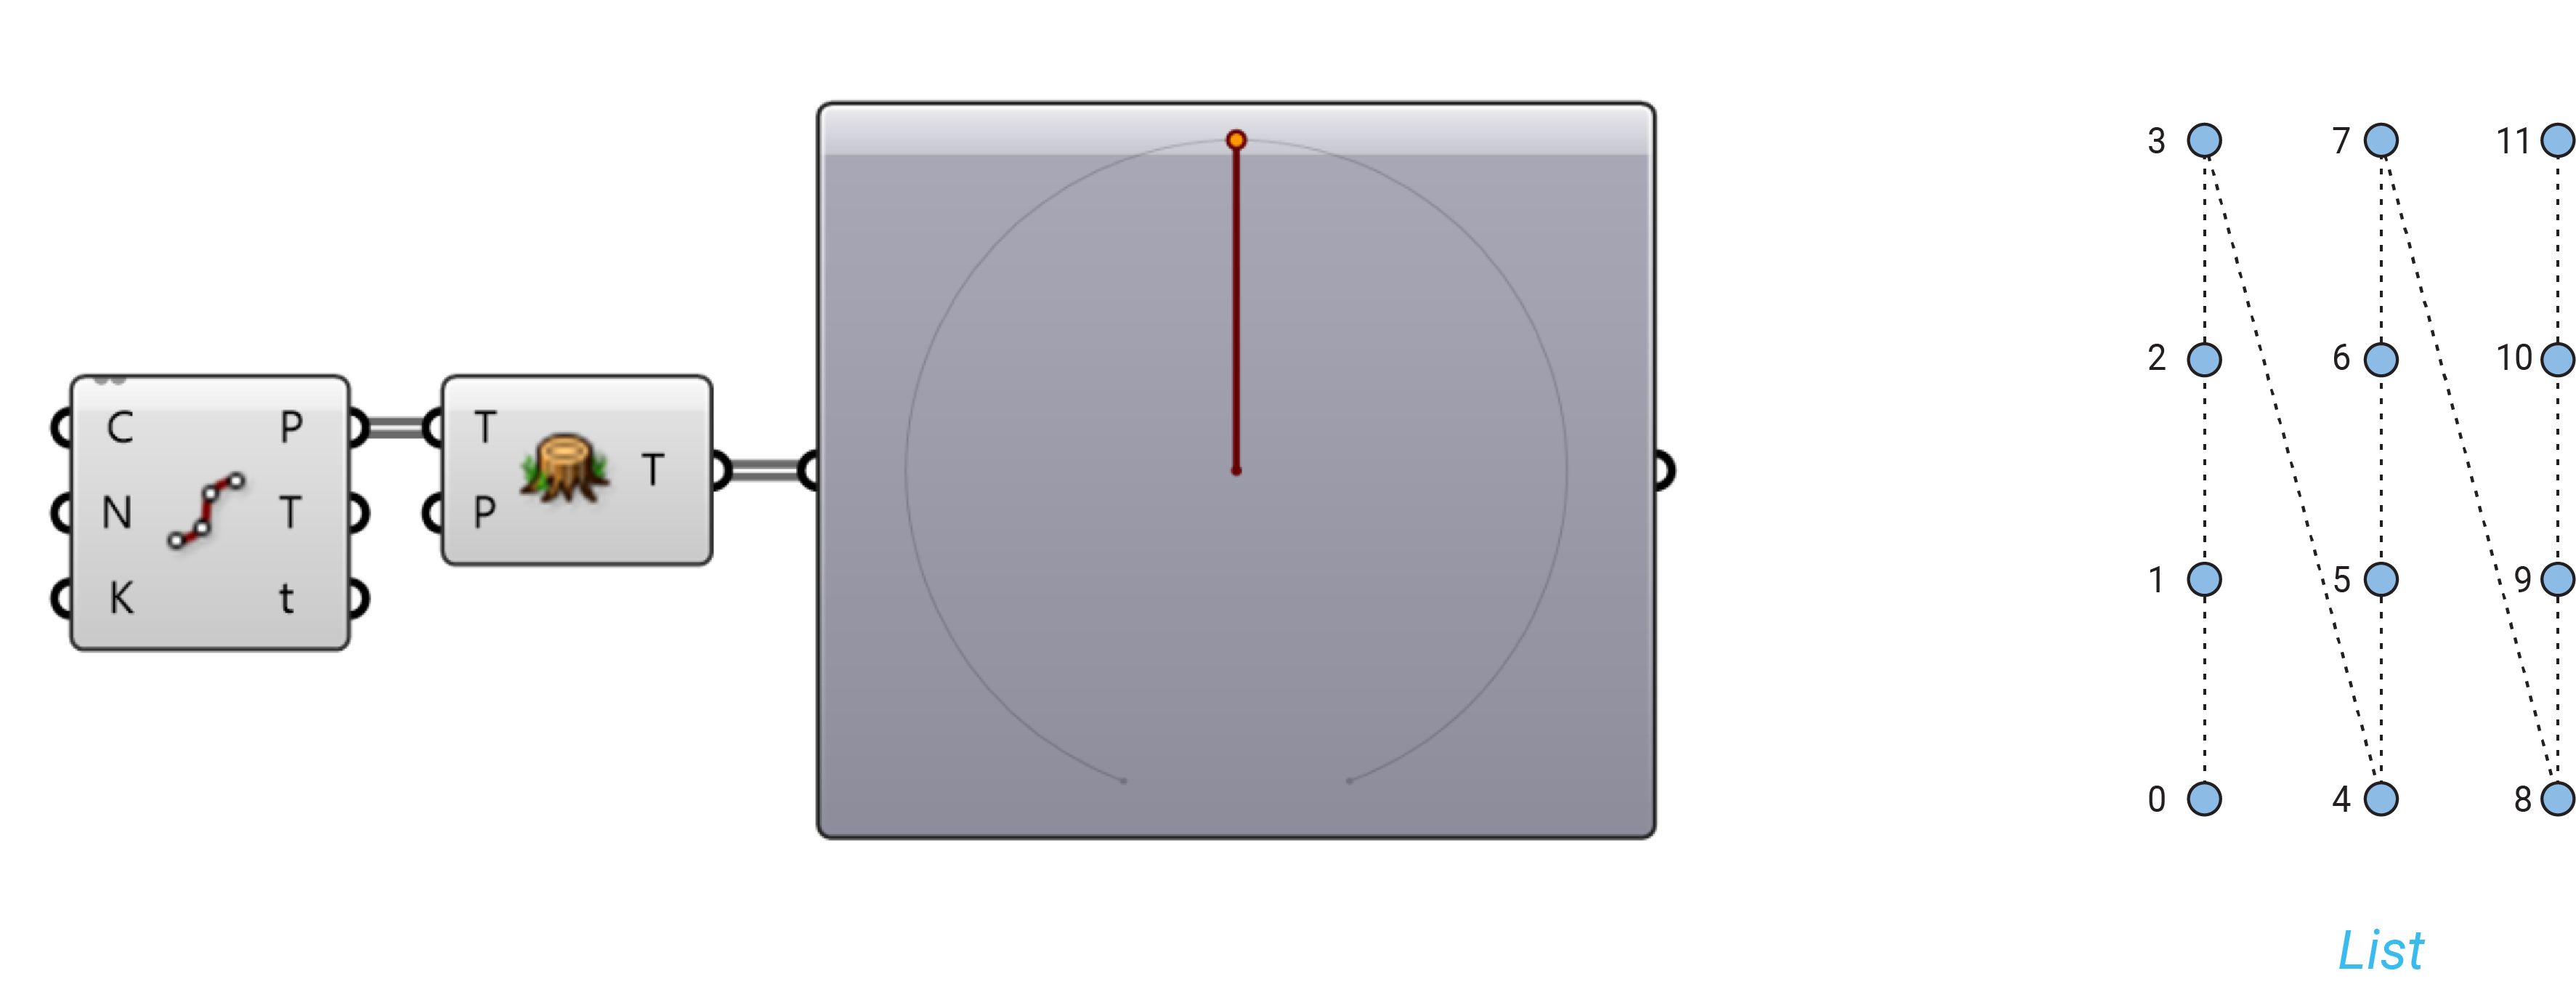
Flatten tree
Flatten removes all levels of a Data Tree, resulting in a single List. (Sets/Tree/Flatten Tree)
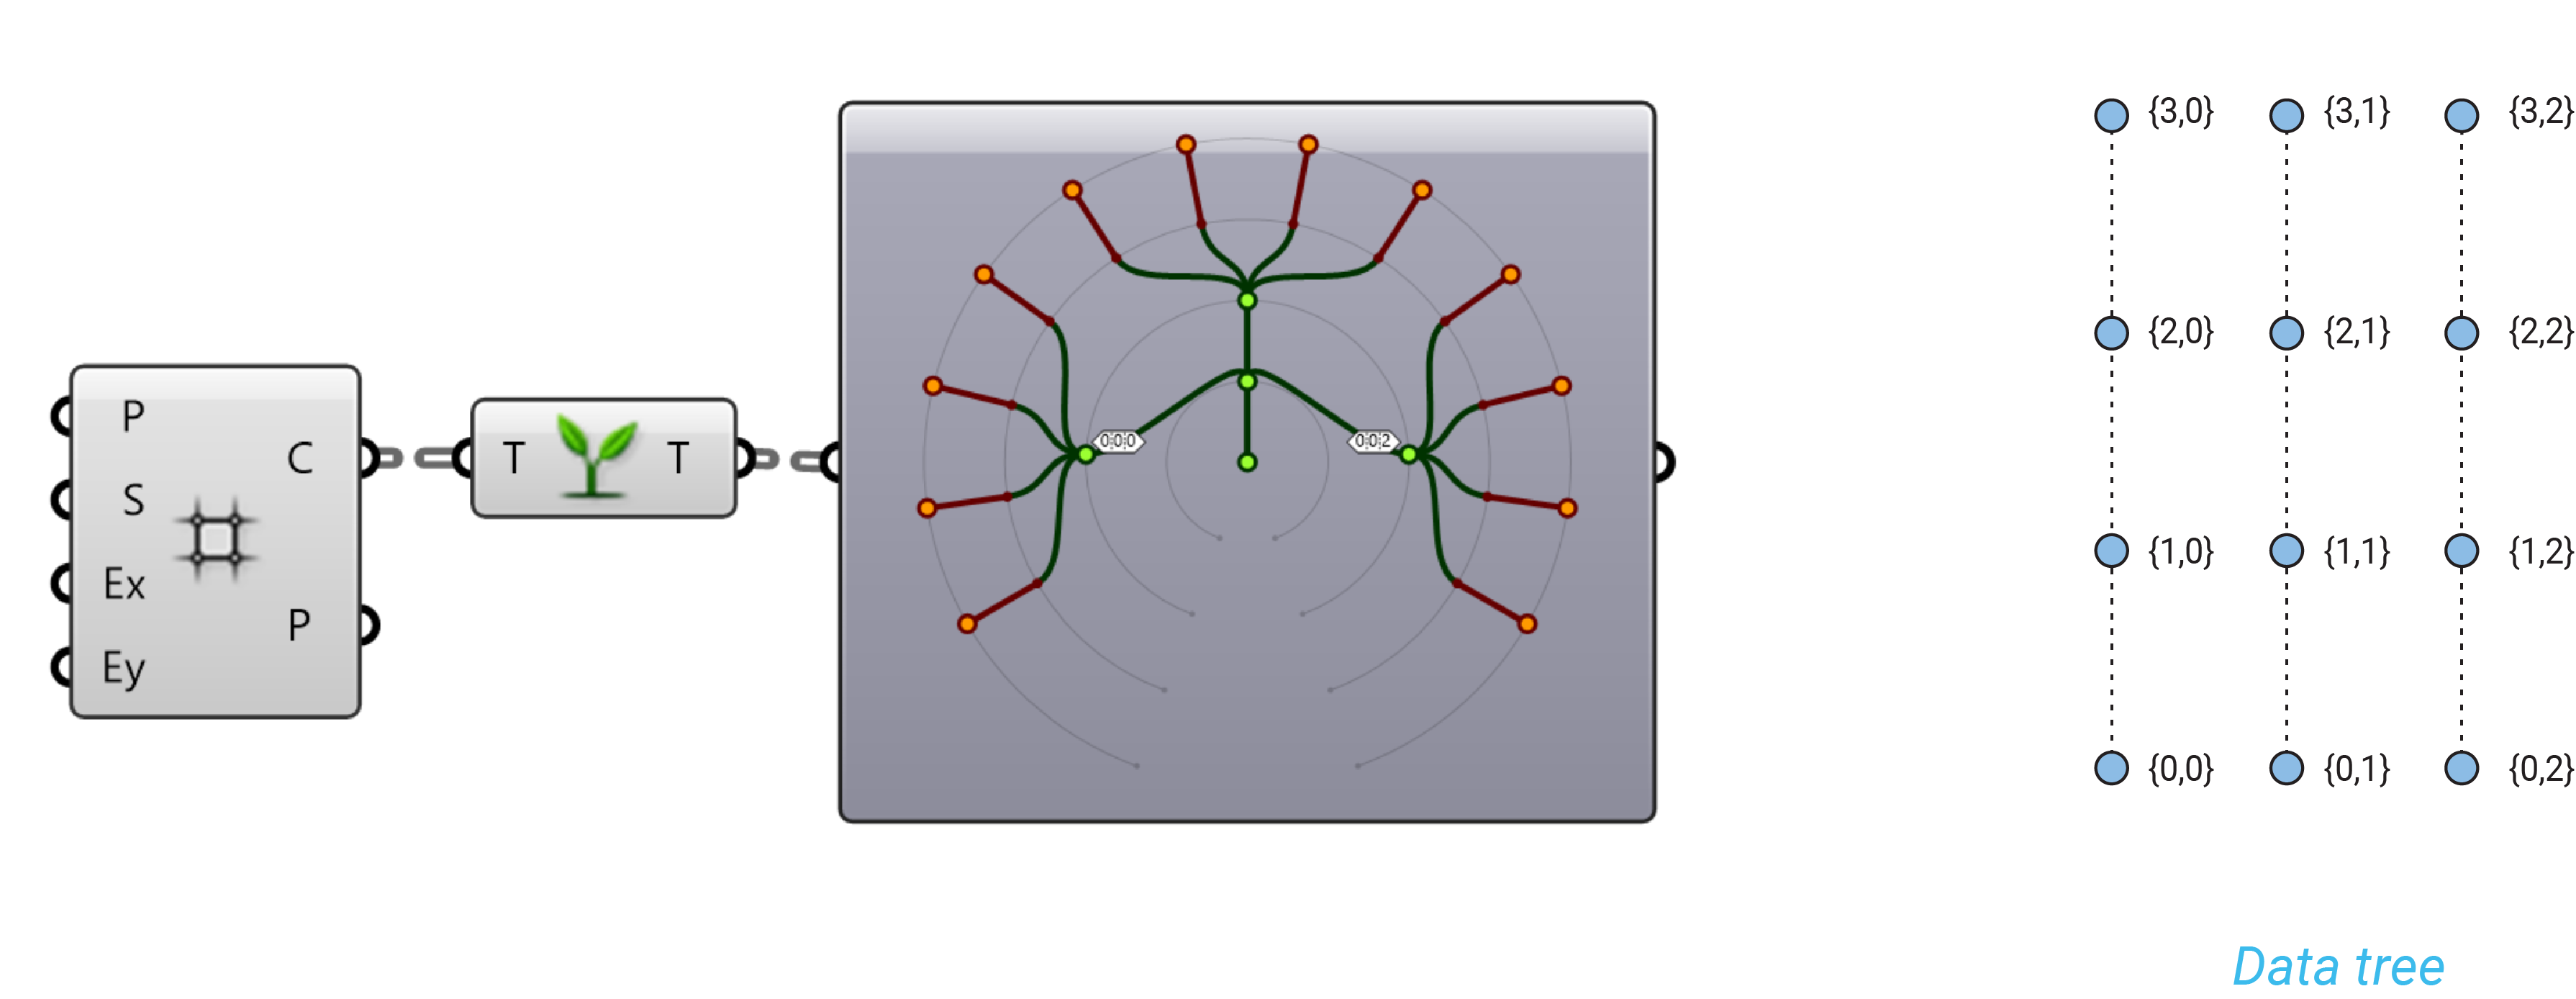
Graft Tree
Graft Tree creates a new Branch for every Data Item. (Sets/Tree/Graft Tree)
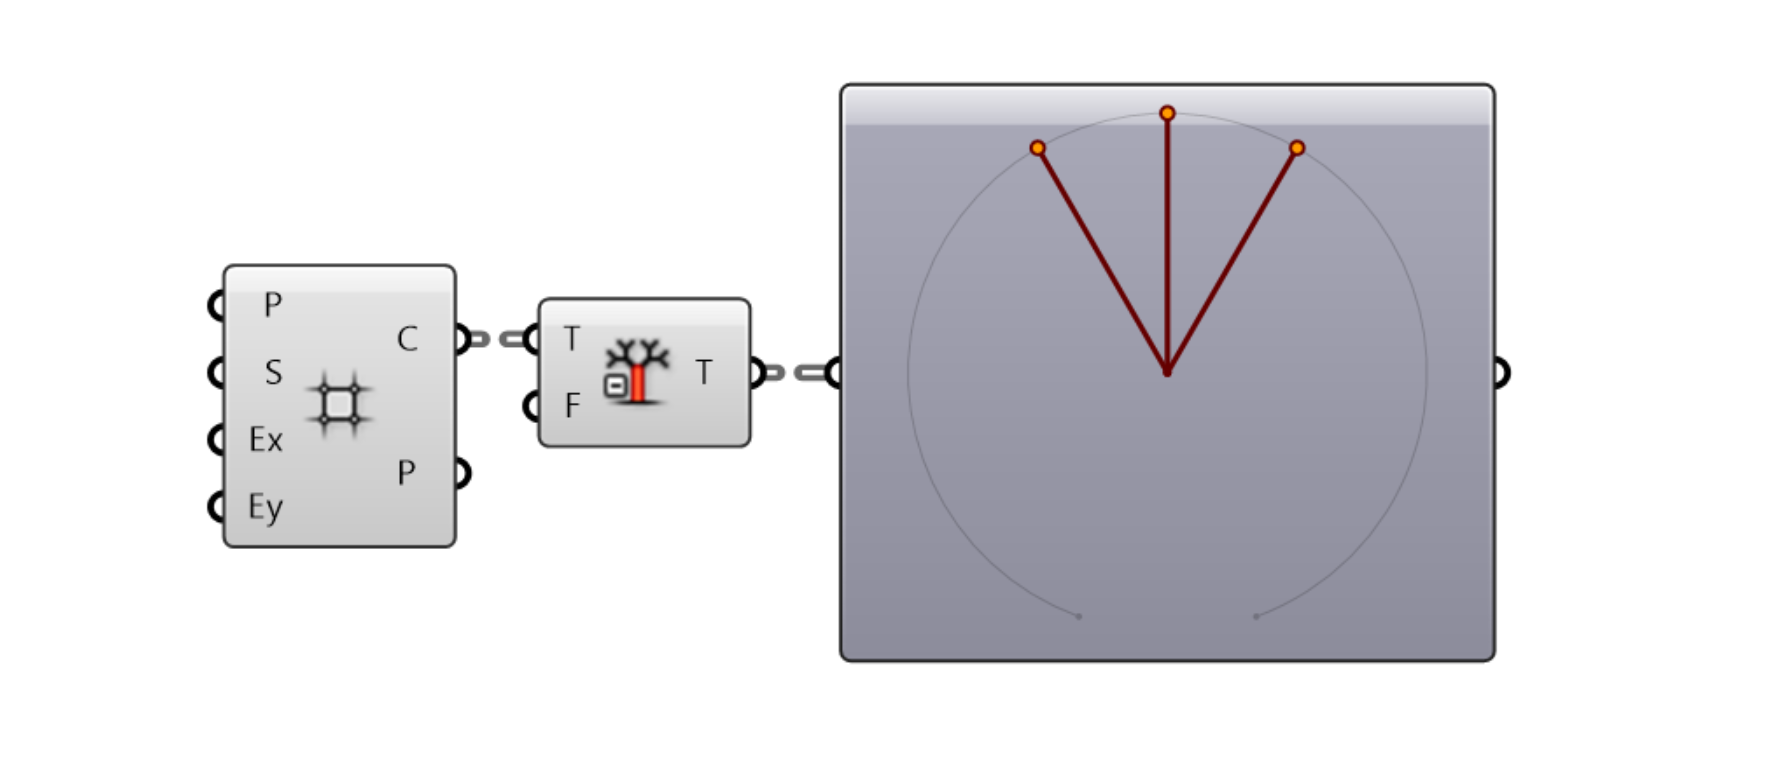
Simplify tree
Simplify removes overlapping branches in a Data Tree. (Sets/Tree/Simplify Tree)
Flip Matrix
Flip Matrix component Swaps the “Rows” and “Columns” of a Data Tree with two Path Indices. (Sets/Tree/Flip Matrix)
Surfaces
NURBS (Non-Uniform Rational B-Splines) are mathematical representations that can accurately model any shape from a simple 2D Line, Circle, Arc, or Box to the most complex 3D free-form organic surface or solid.
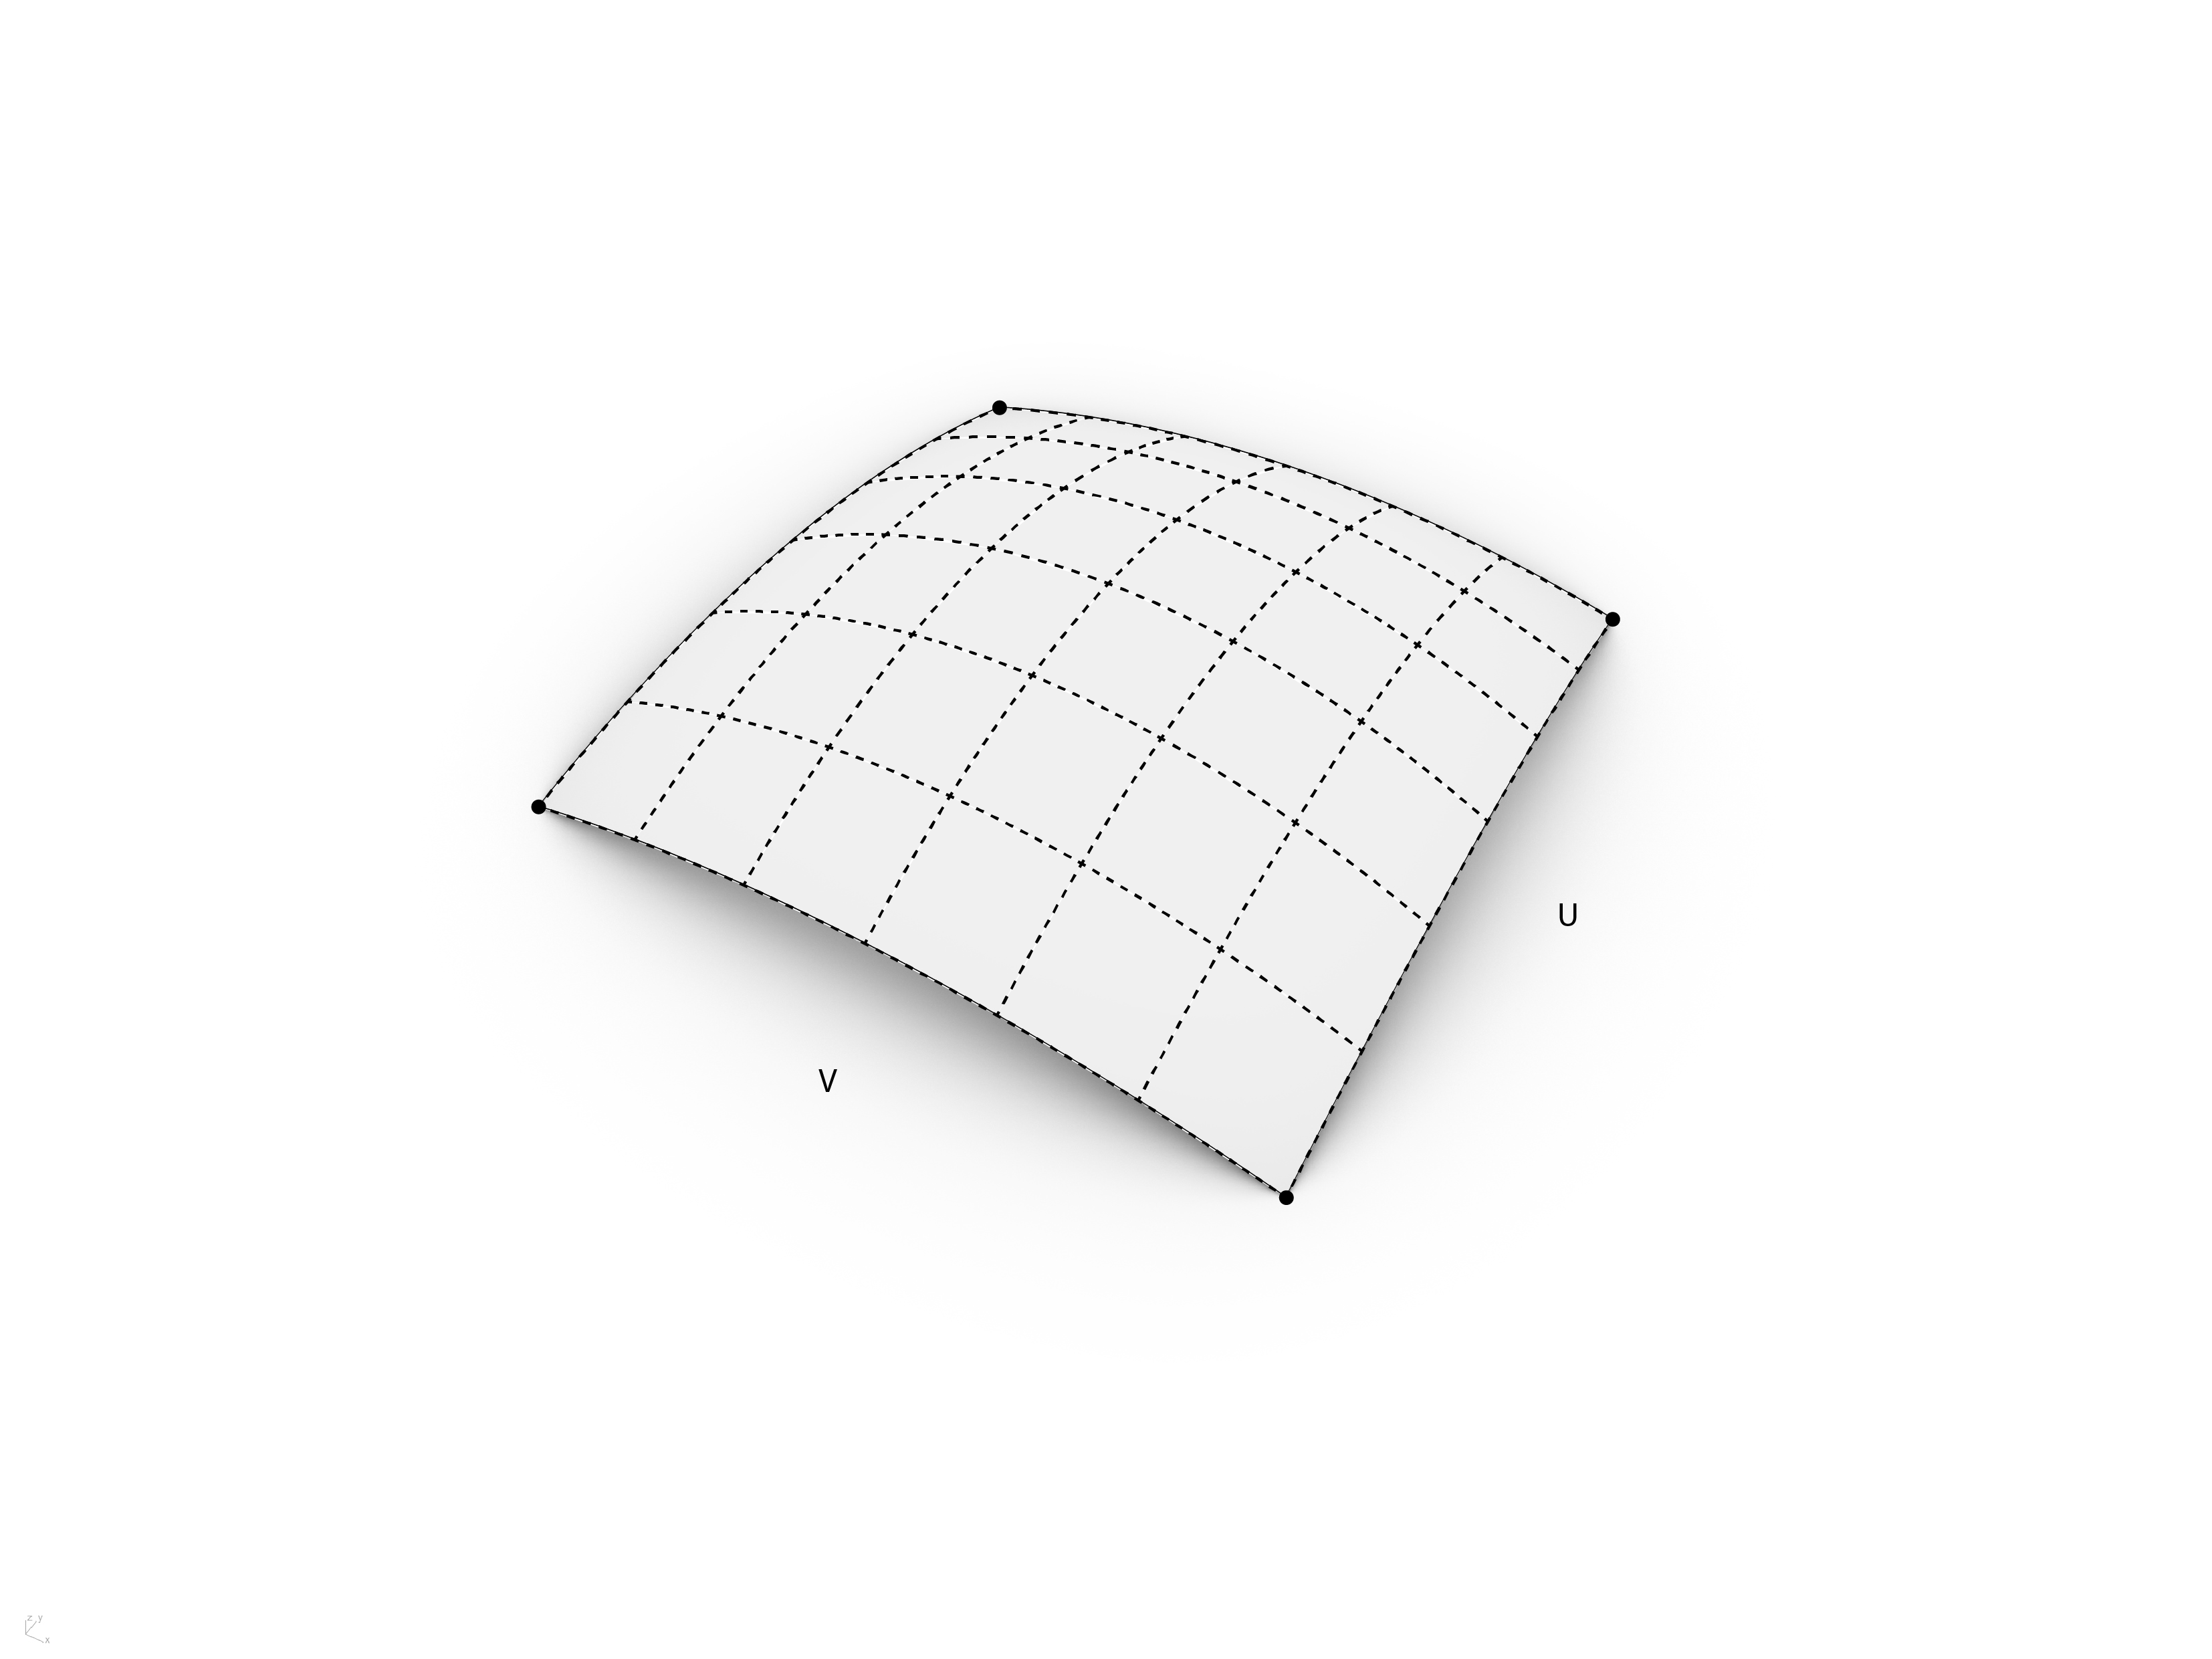
NURBS Surfaces
NURBS surfaces are very similar to NURBS curves. The same algorithms are used to calculate shape, normals, tangents, curvatures and other properties, but there are some distinct differences.
In the case of NURBS surfaces, there are two directions implied by the geometry. A rectangular grids of {u} and {v} curves.
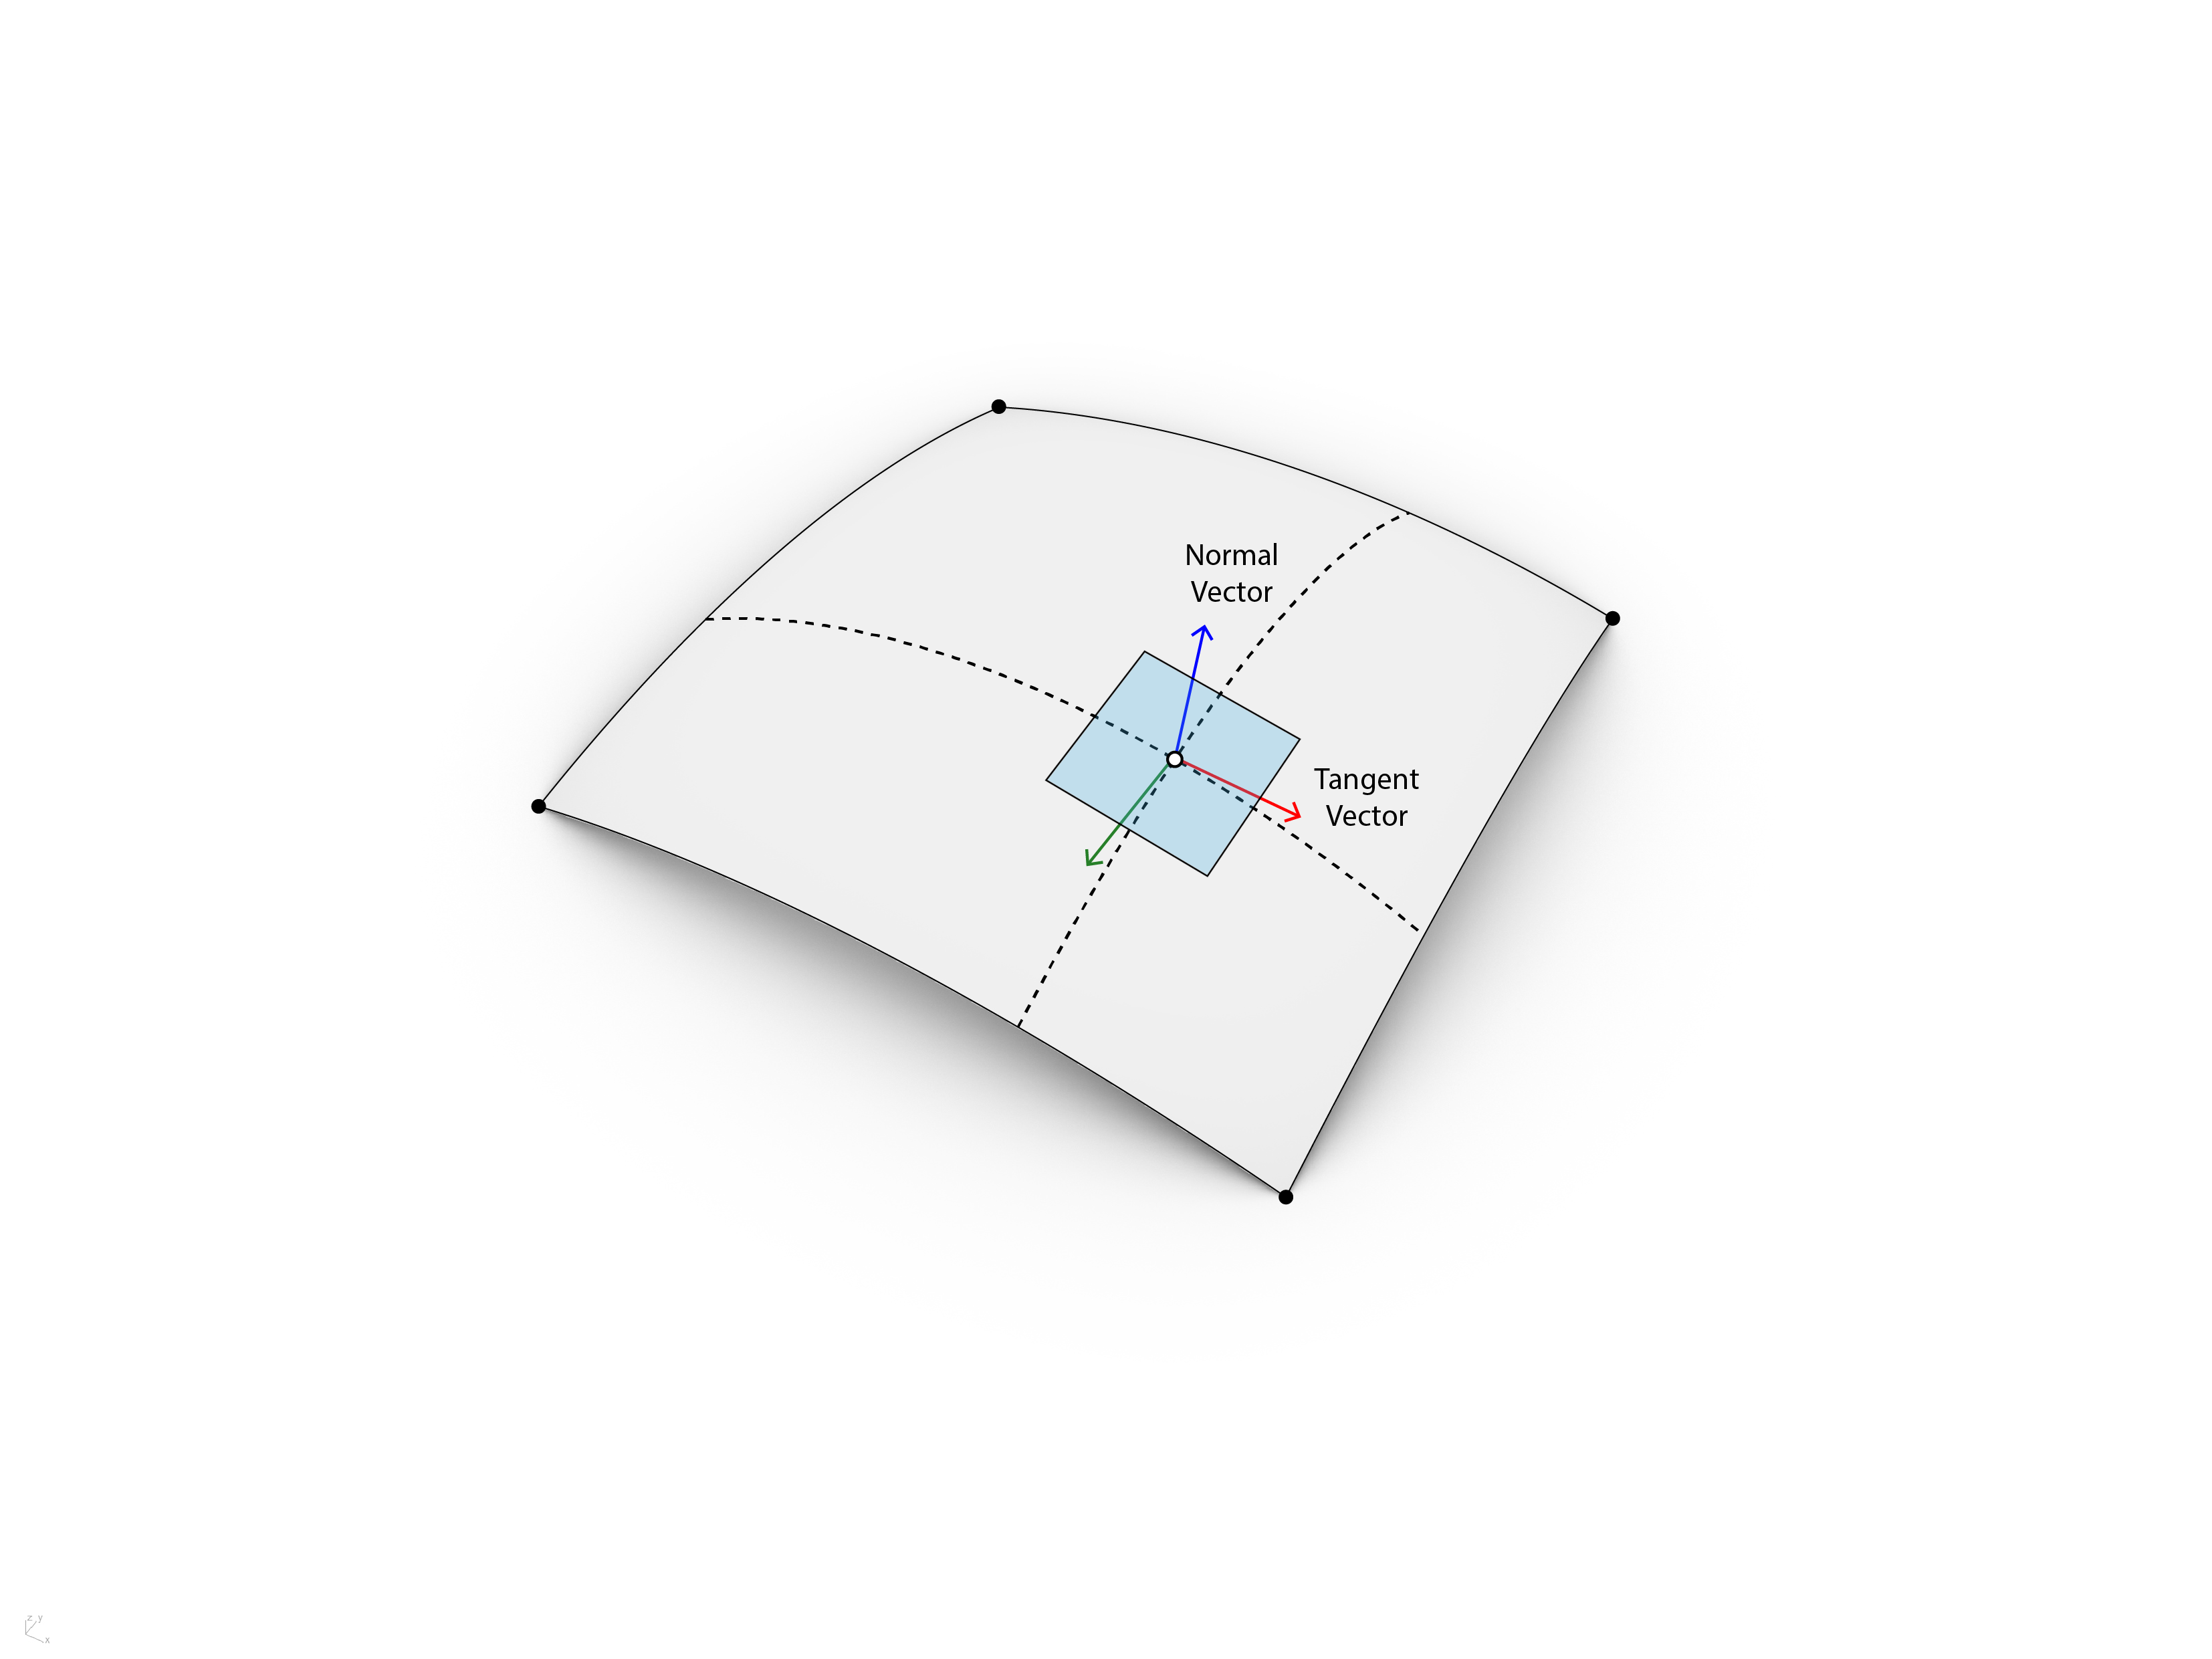
Normal Vectors and Tangent Planes
The tangent plane to a surface at a given point is the plane that touches the surface at that point. The z-direction of the tangent plane represents the normal direction of the surface at that point.
Curves have tangent vectors and normal planes, whereas surfaces have normal vectors and tangent planes.
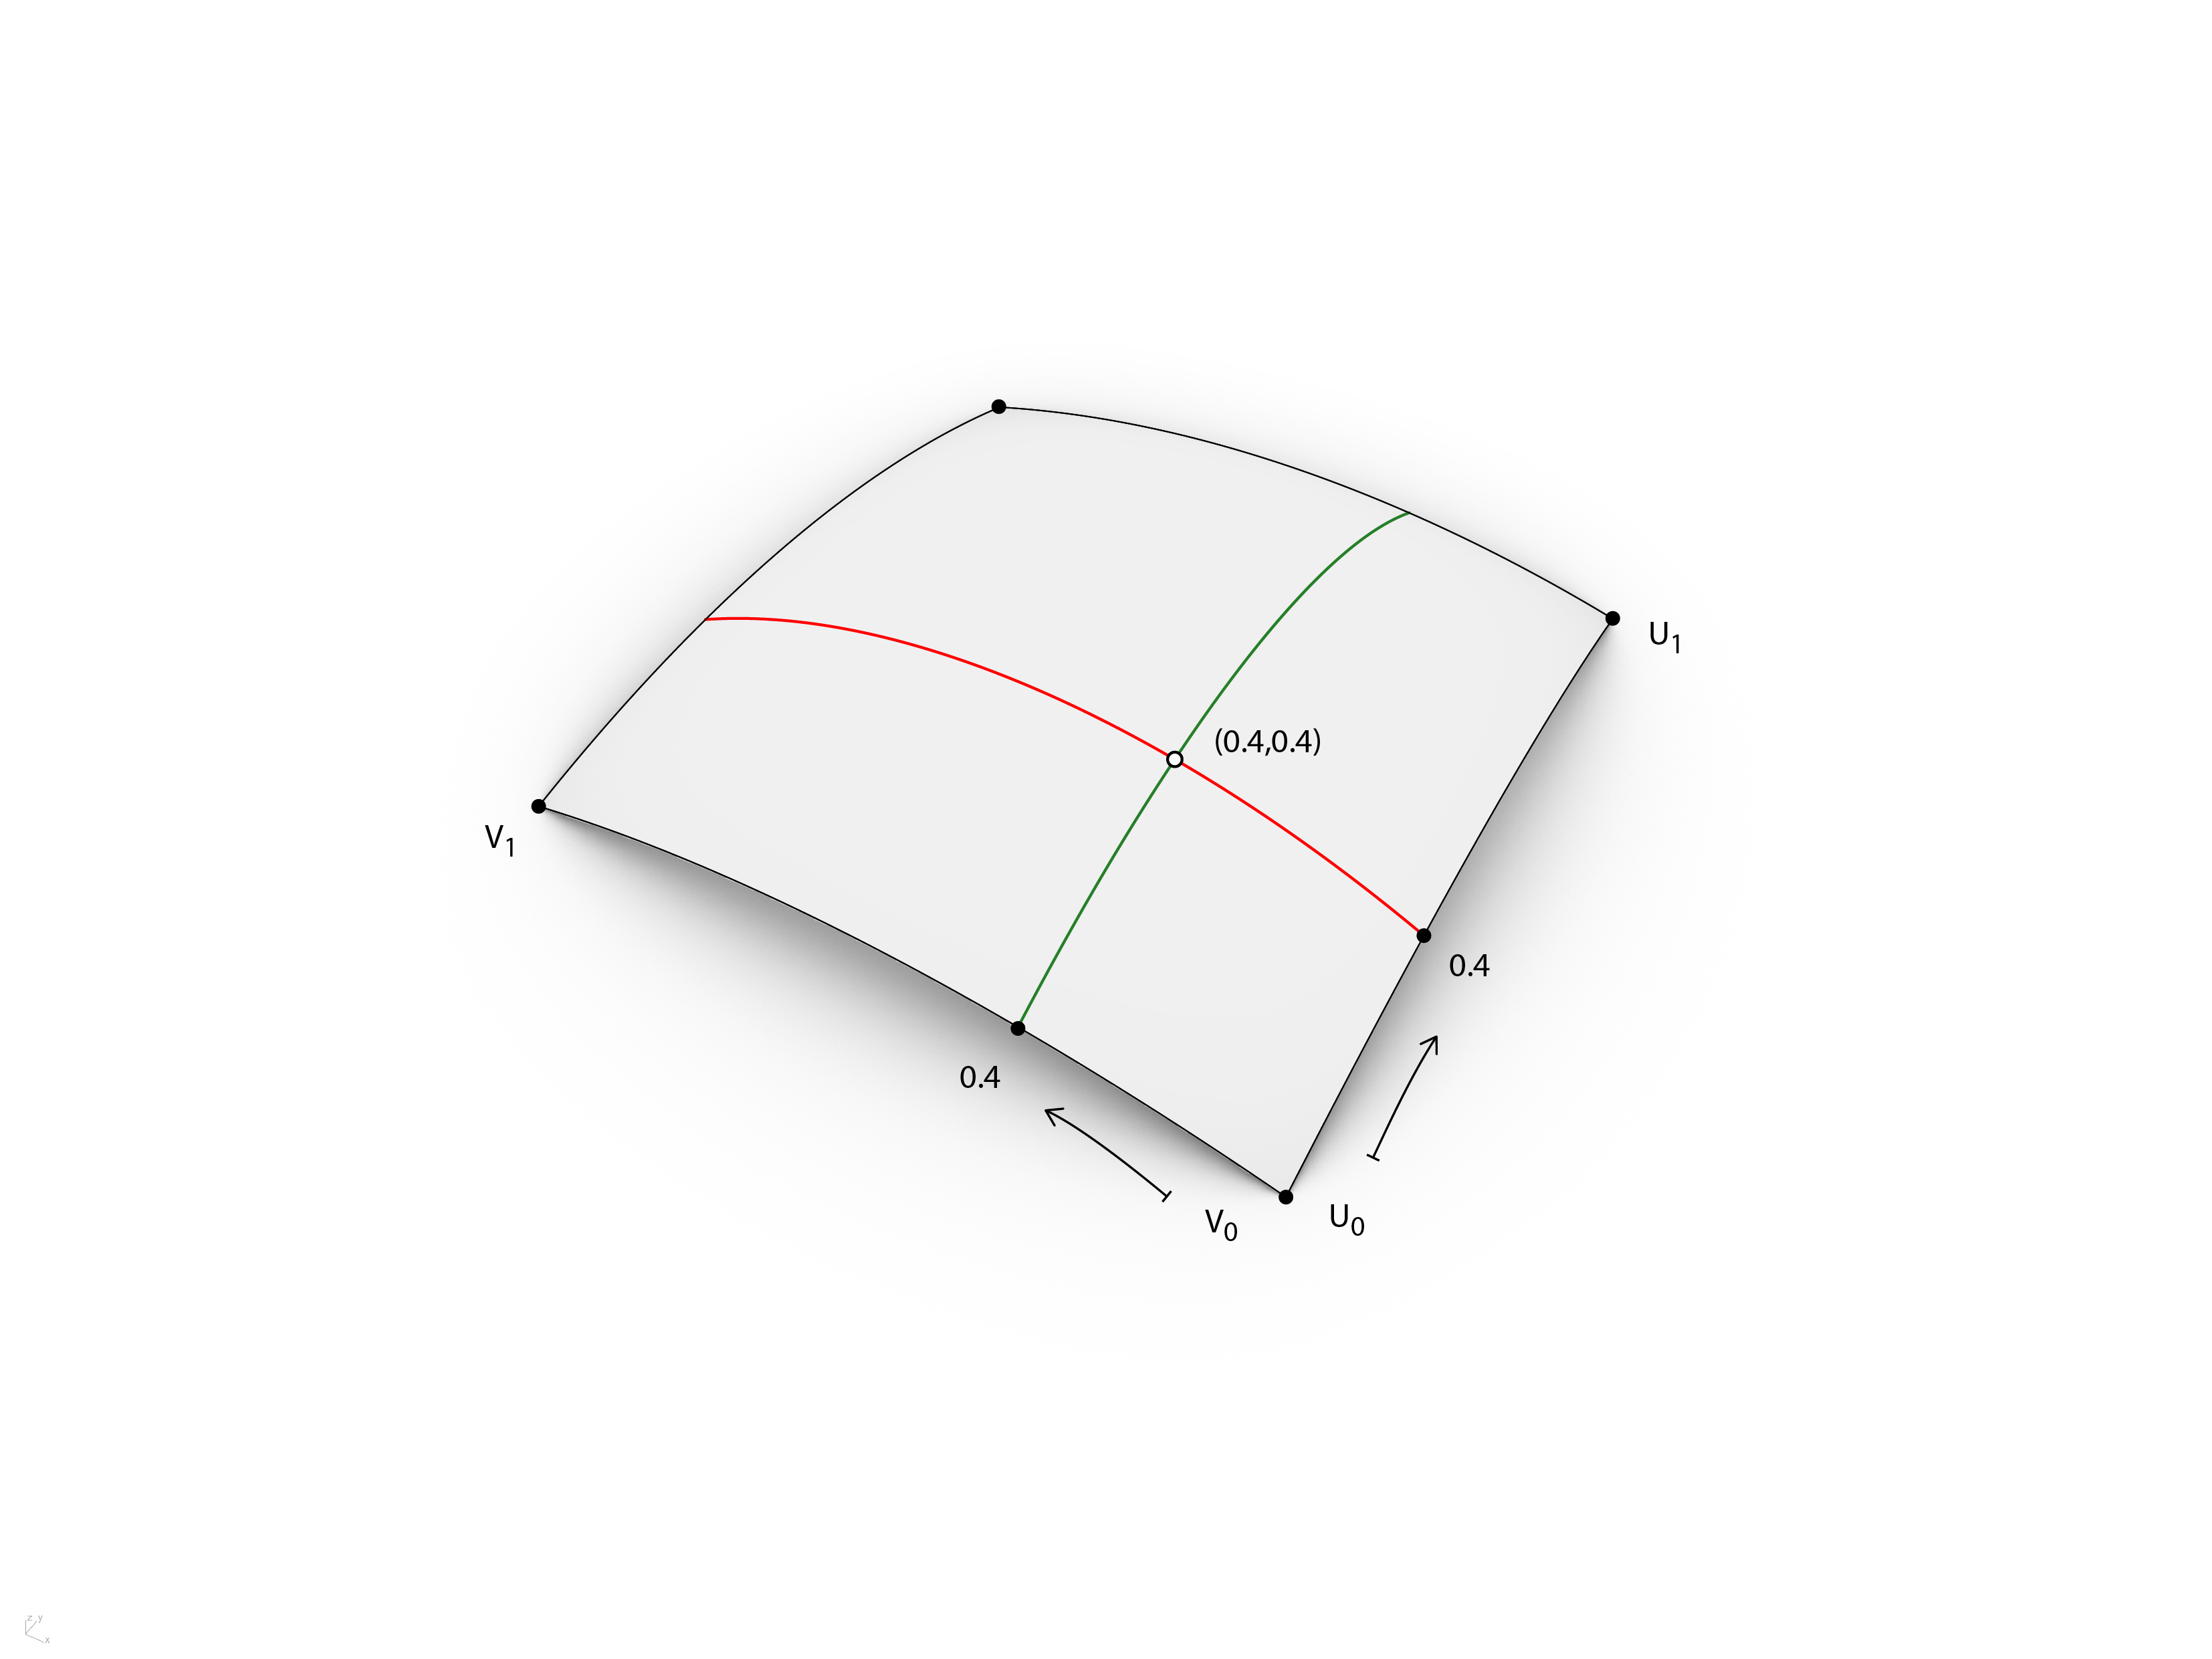
Evaluate surface
Evaluating a surface at a parameter that is within the surface domain results in a point that is on the surface.
(see Surface Domain)
Surface Domain
A surface domain is defined as the range of (u,v) parameters that evaluate into a 3D Point on that surface.
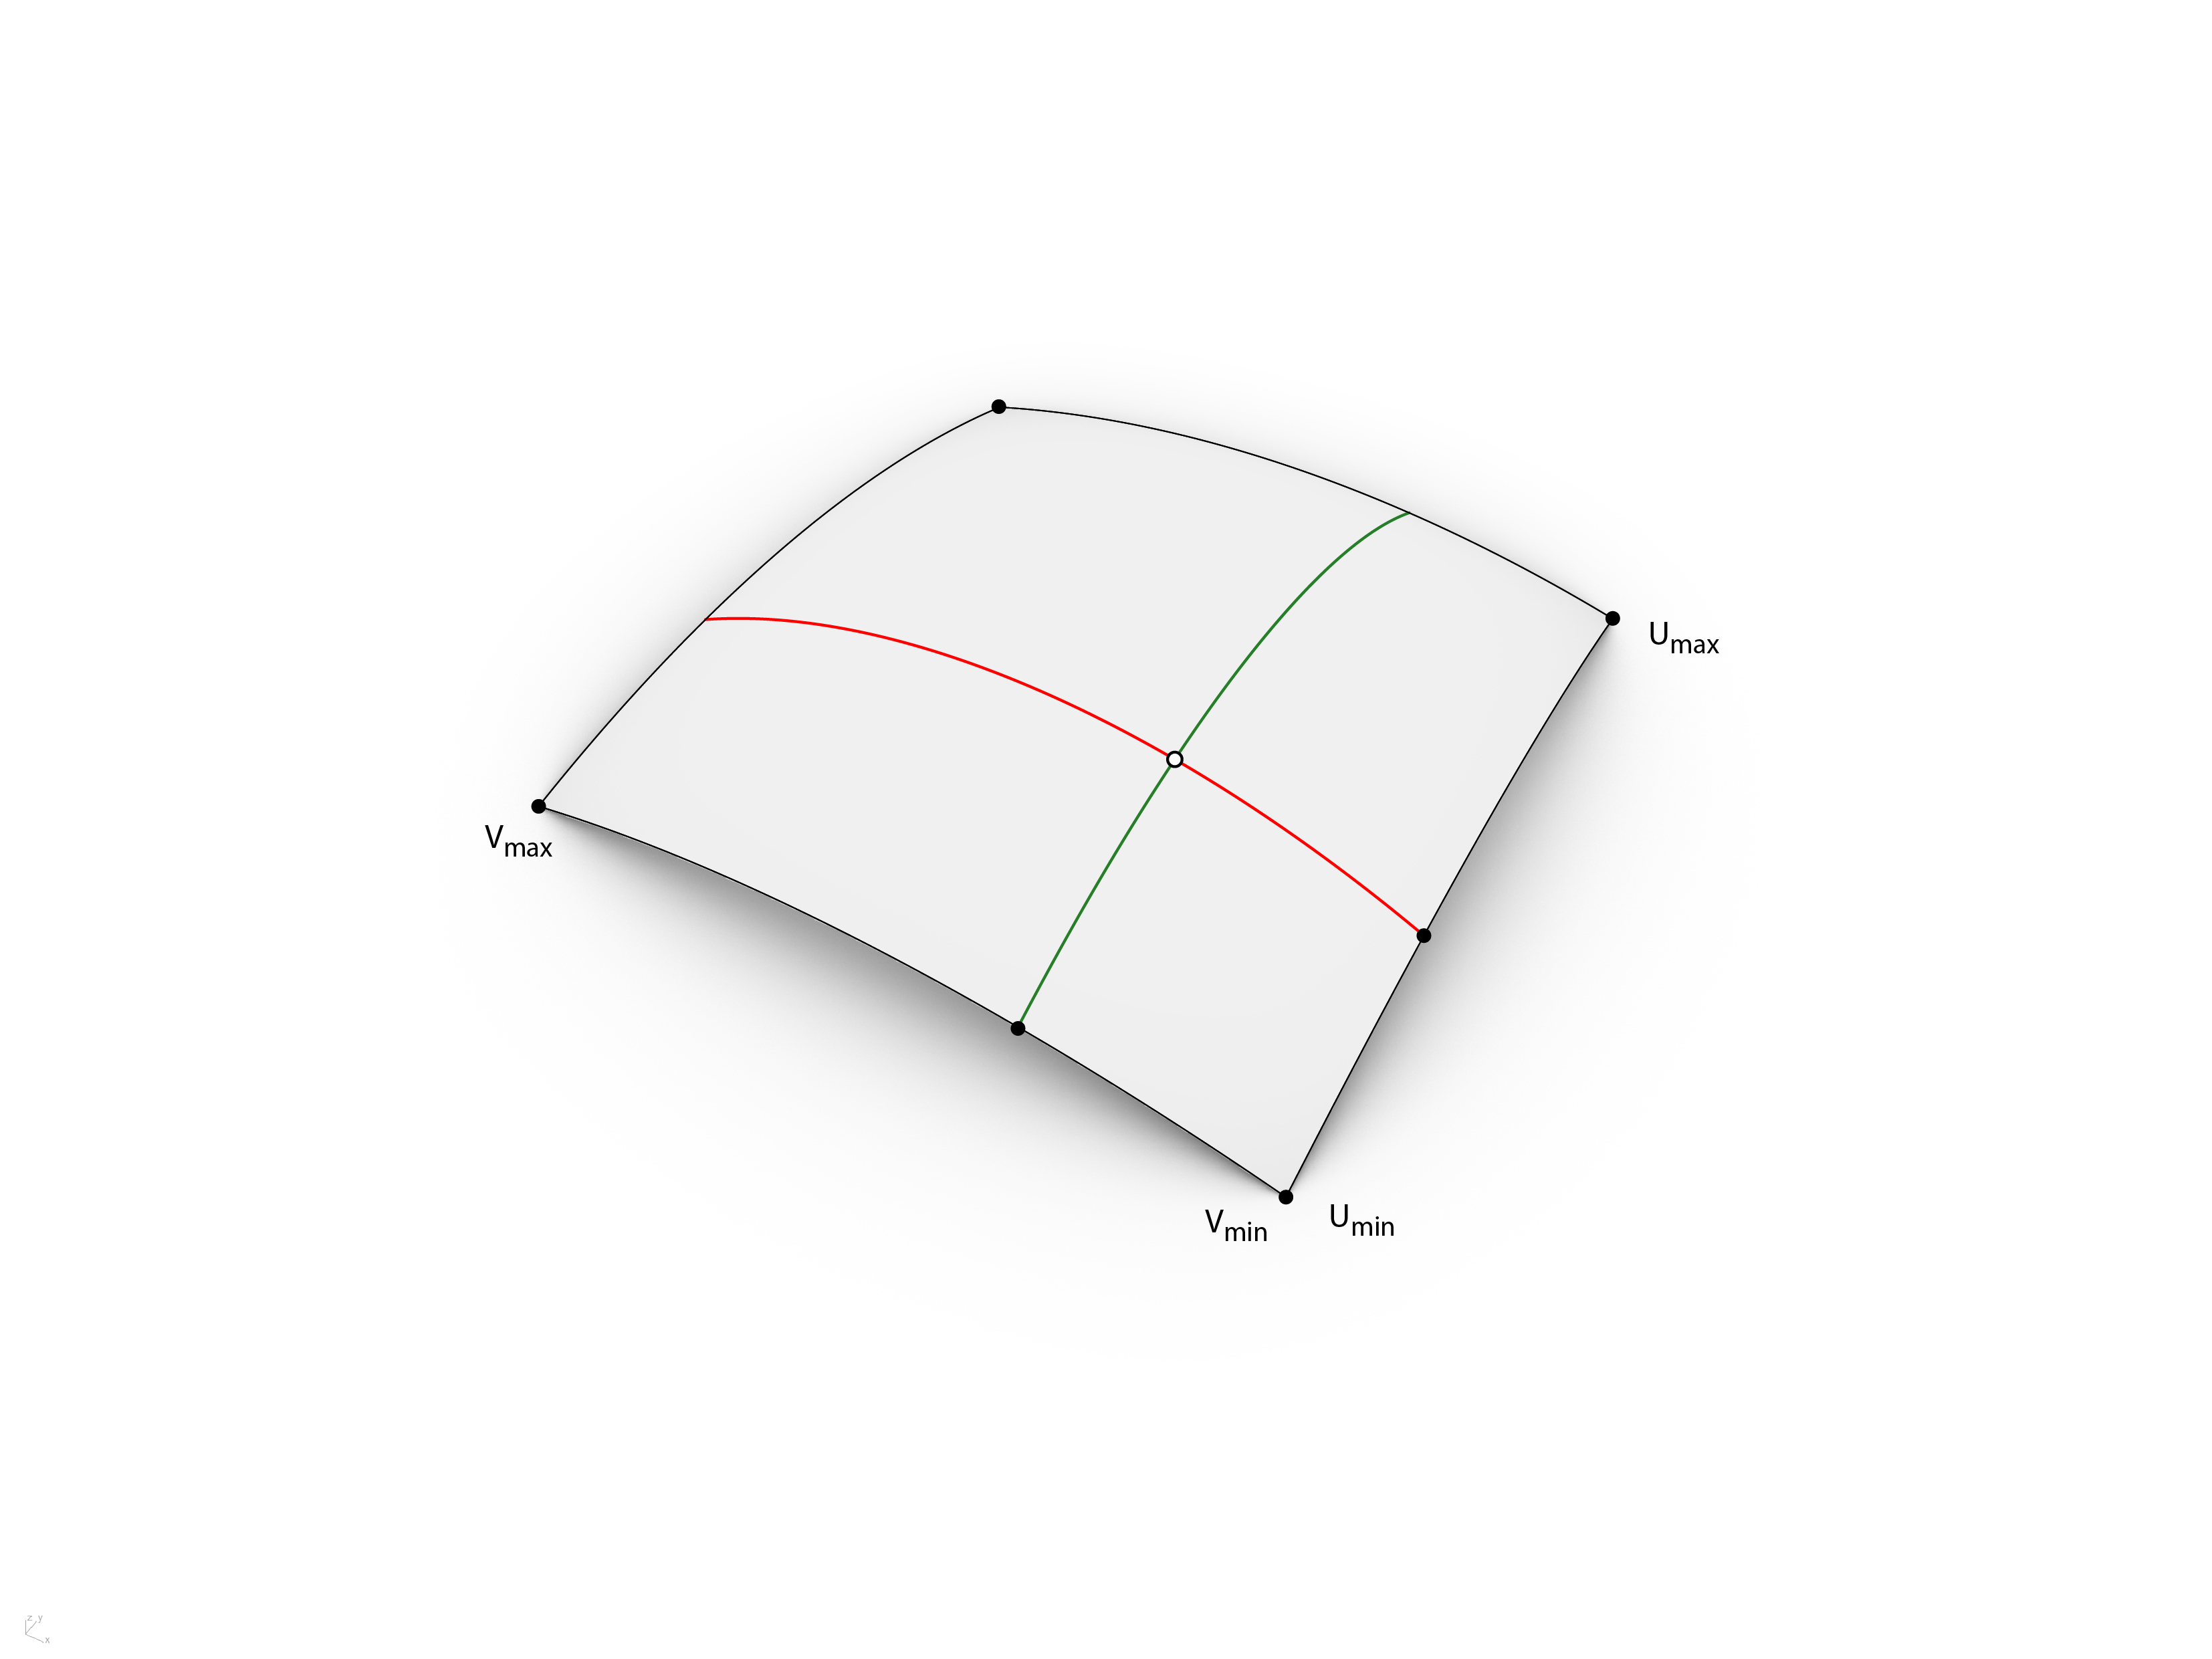
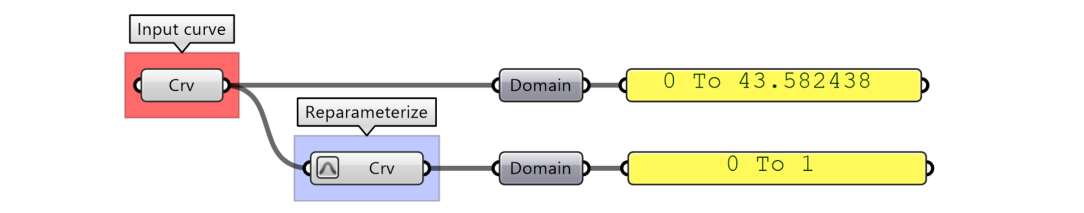
Reparametrize
Reparameterize NURBS surfaces is often useful, so that the u and v domains both range from 0 to 1. This allows us to easily evaluate and operate on the surface.
i.e. Reparameterization of a curve
Meshes
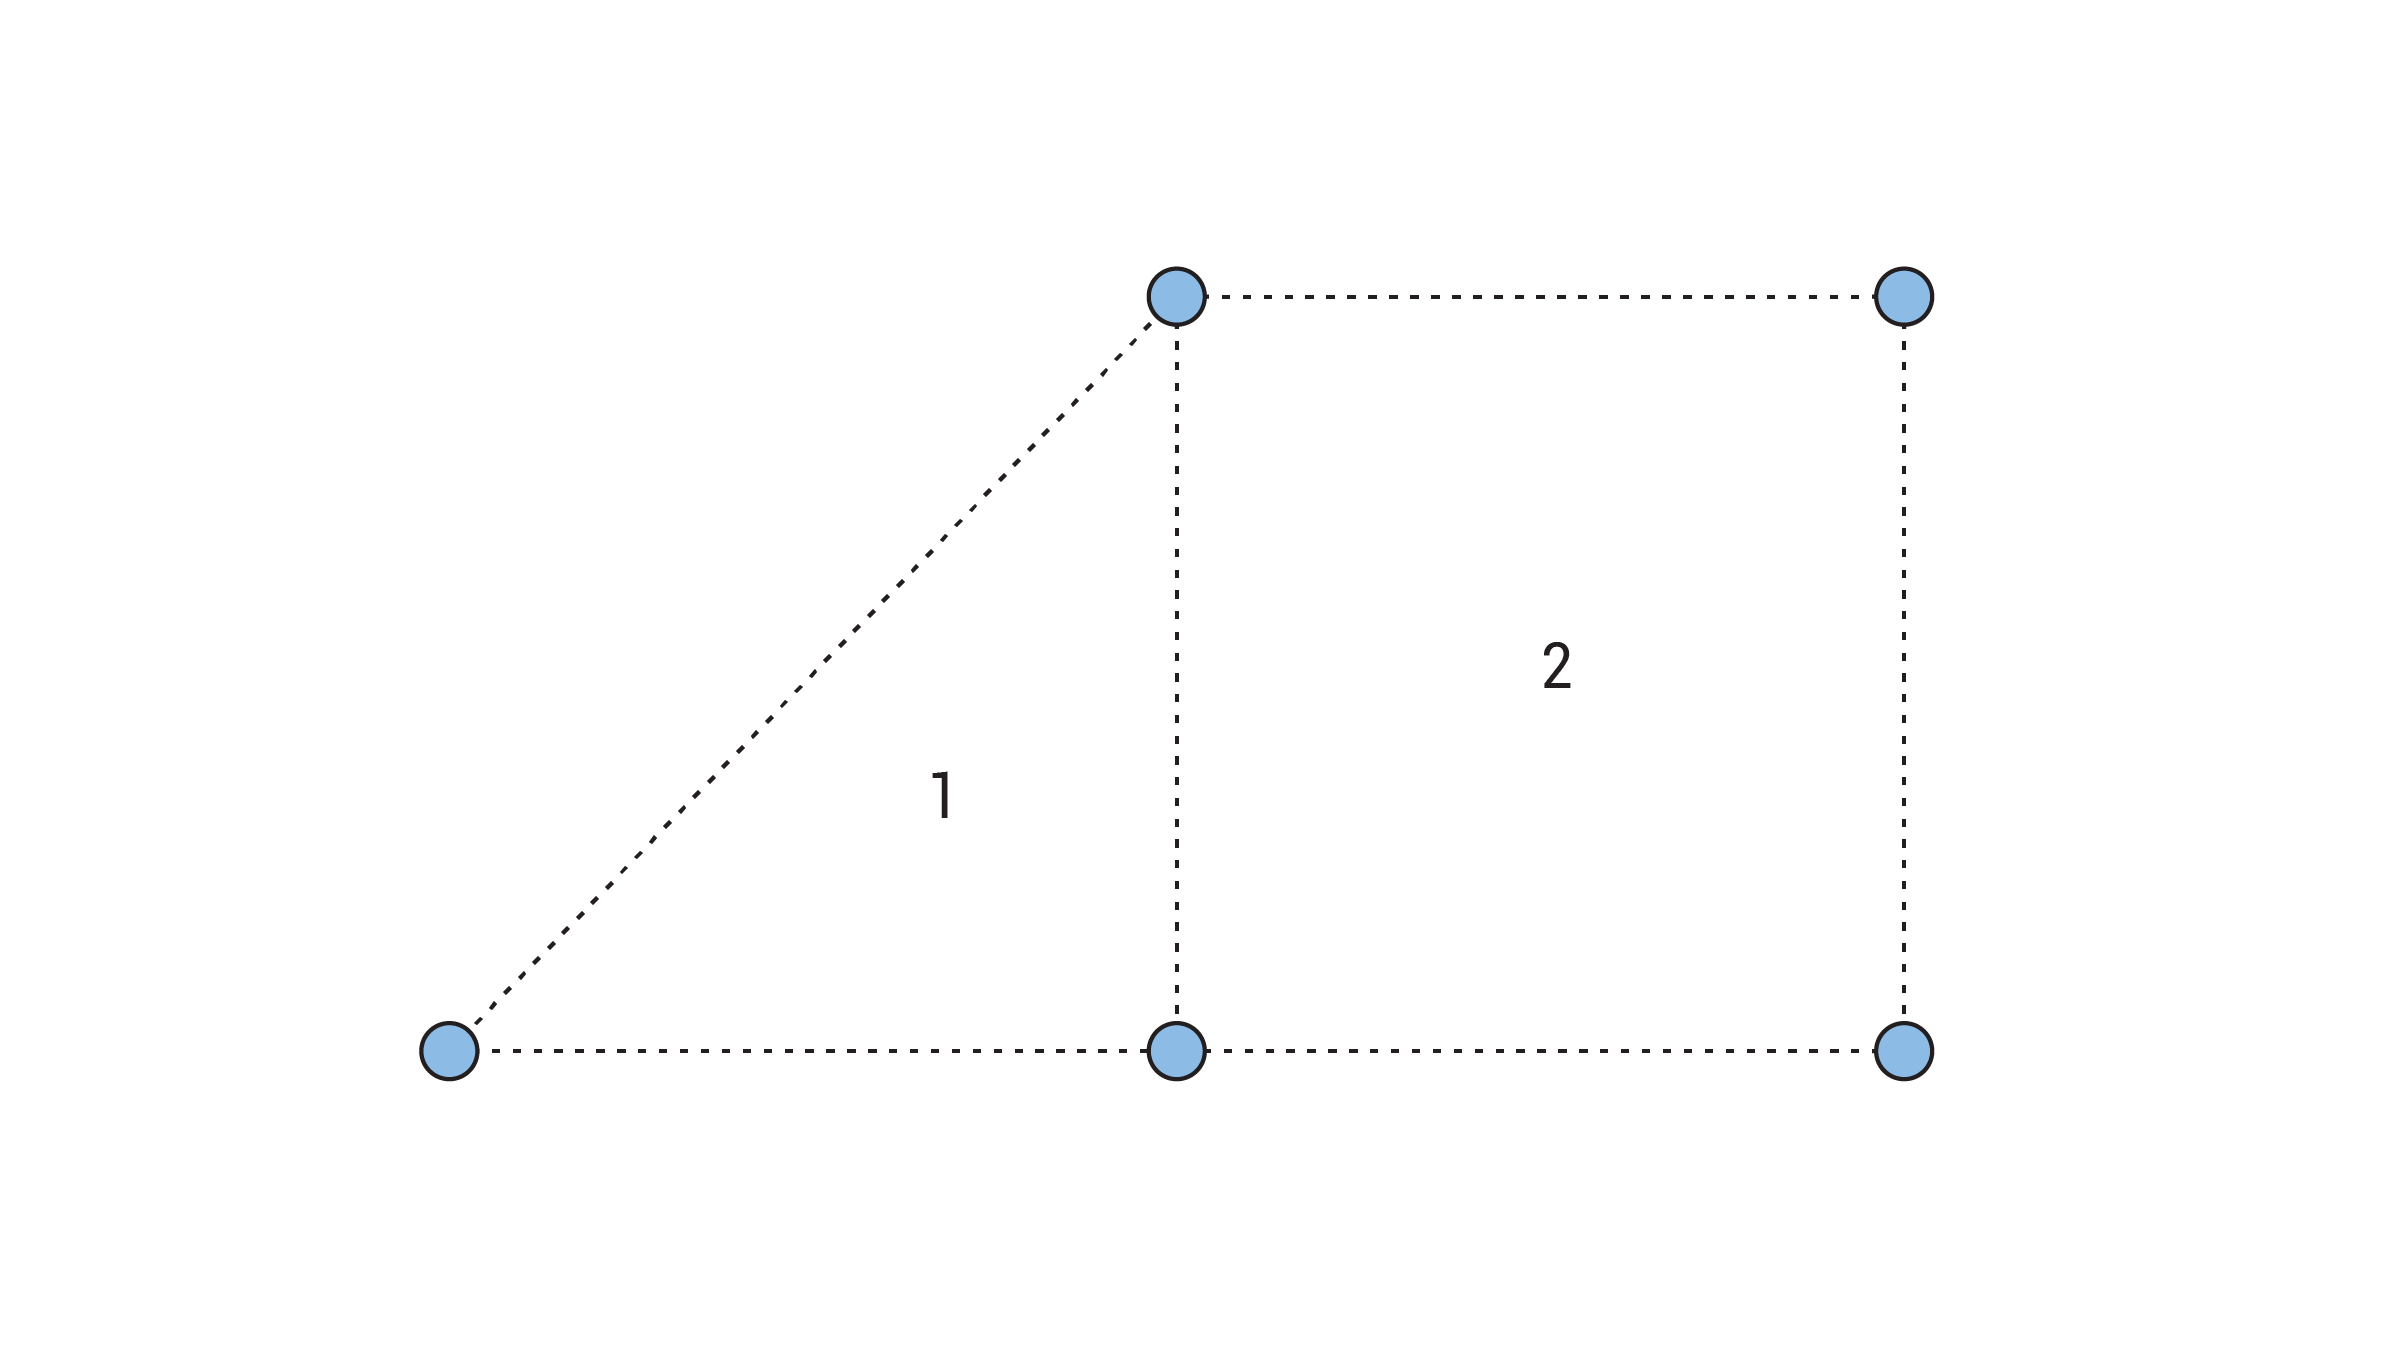
A Mesh is a collection of quadrilaterals (quads) and triangles that represents a surface or solid geometry. This section discusses the structure of a mesh object, which includes vertices, edges, and faces.
Anatomy
Collection of points which are grouped into polygons.
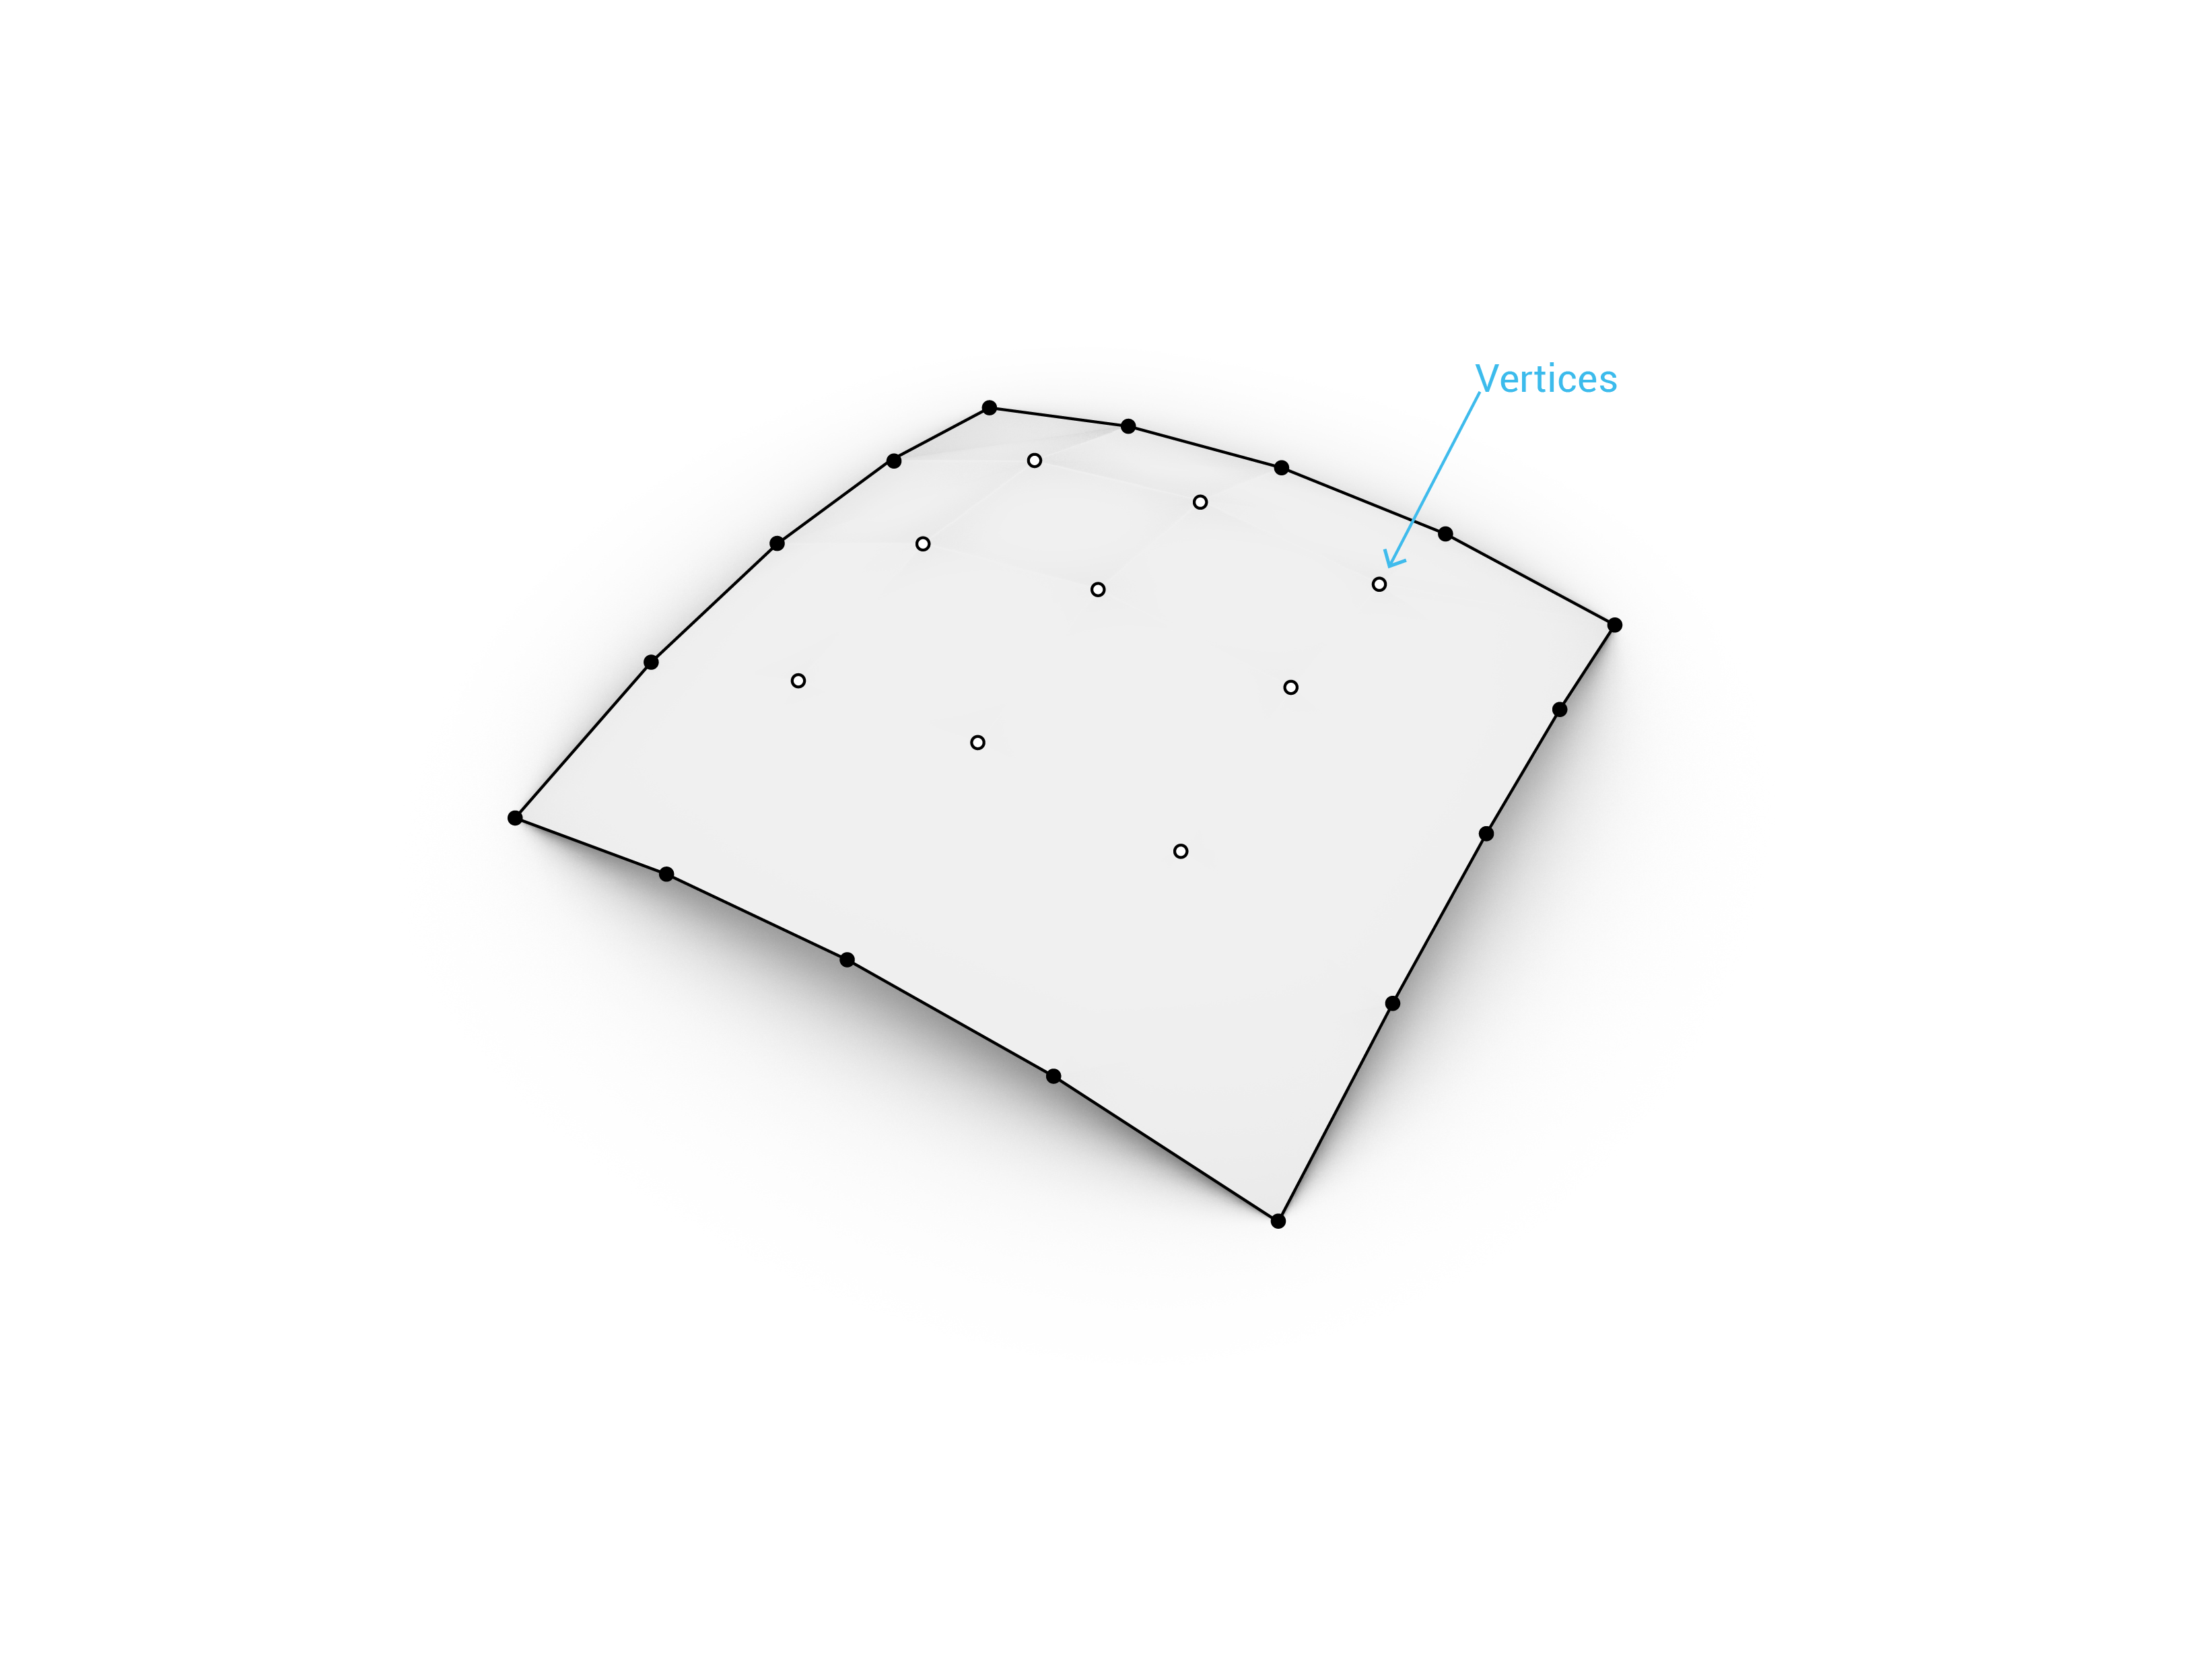
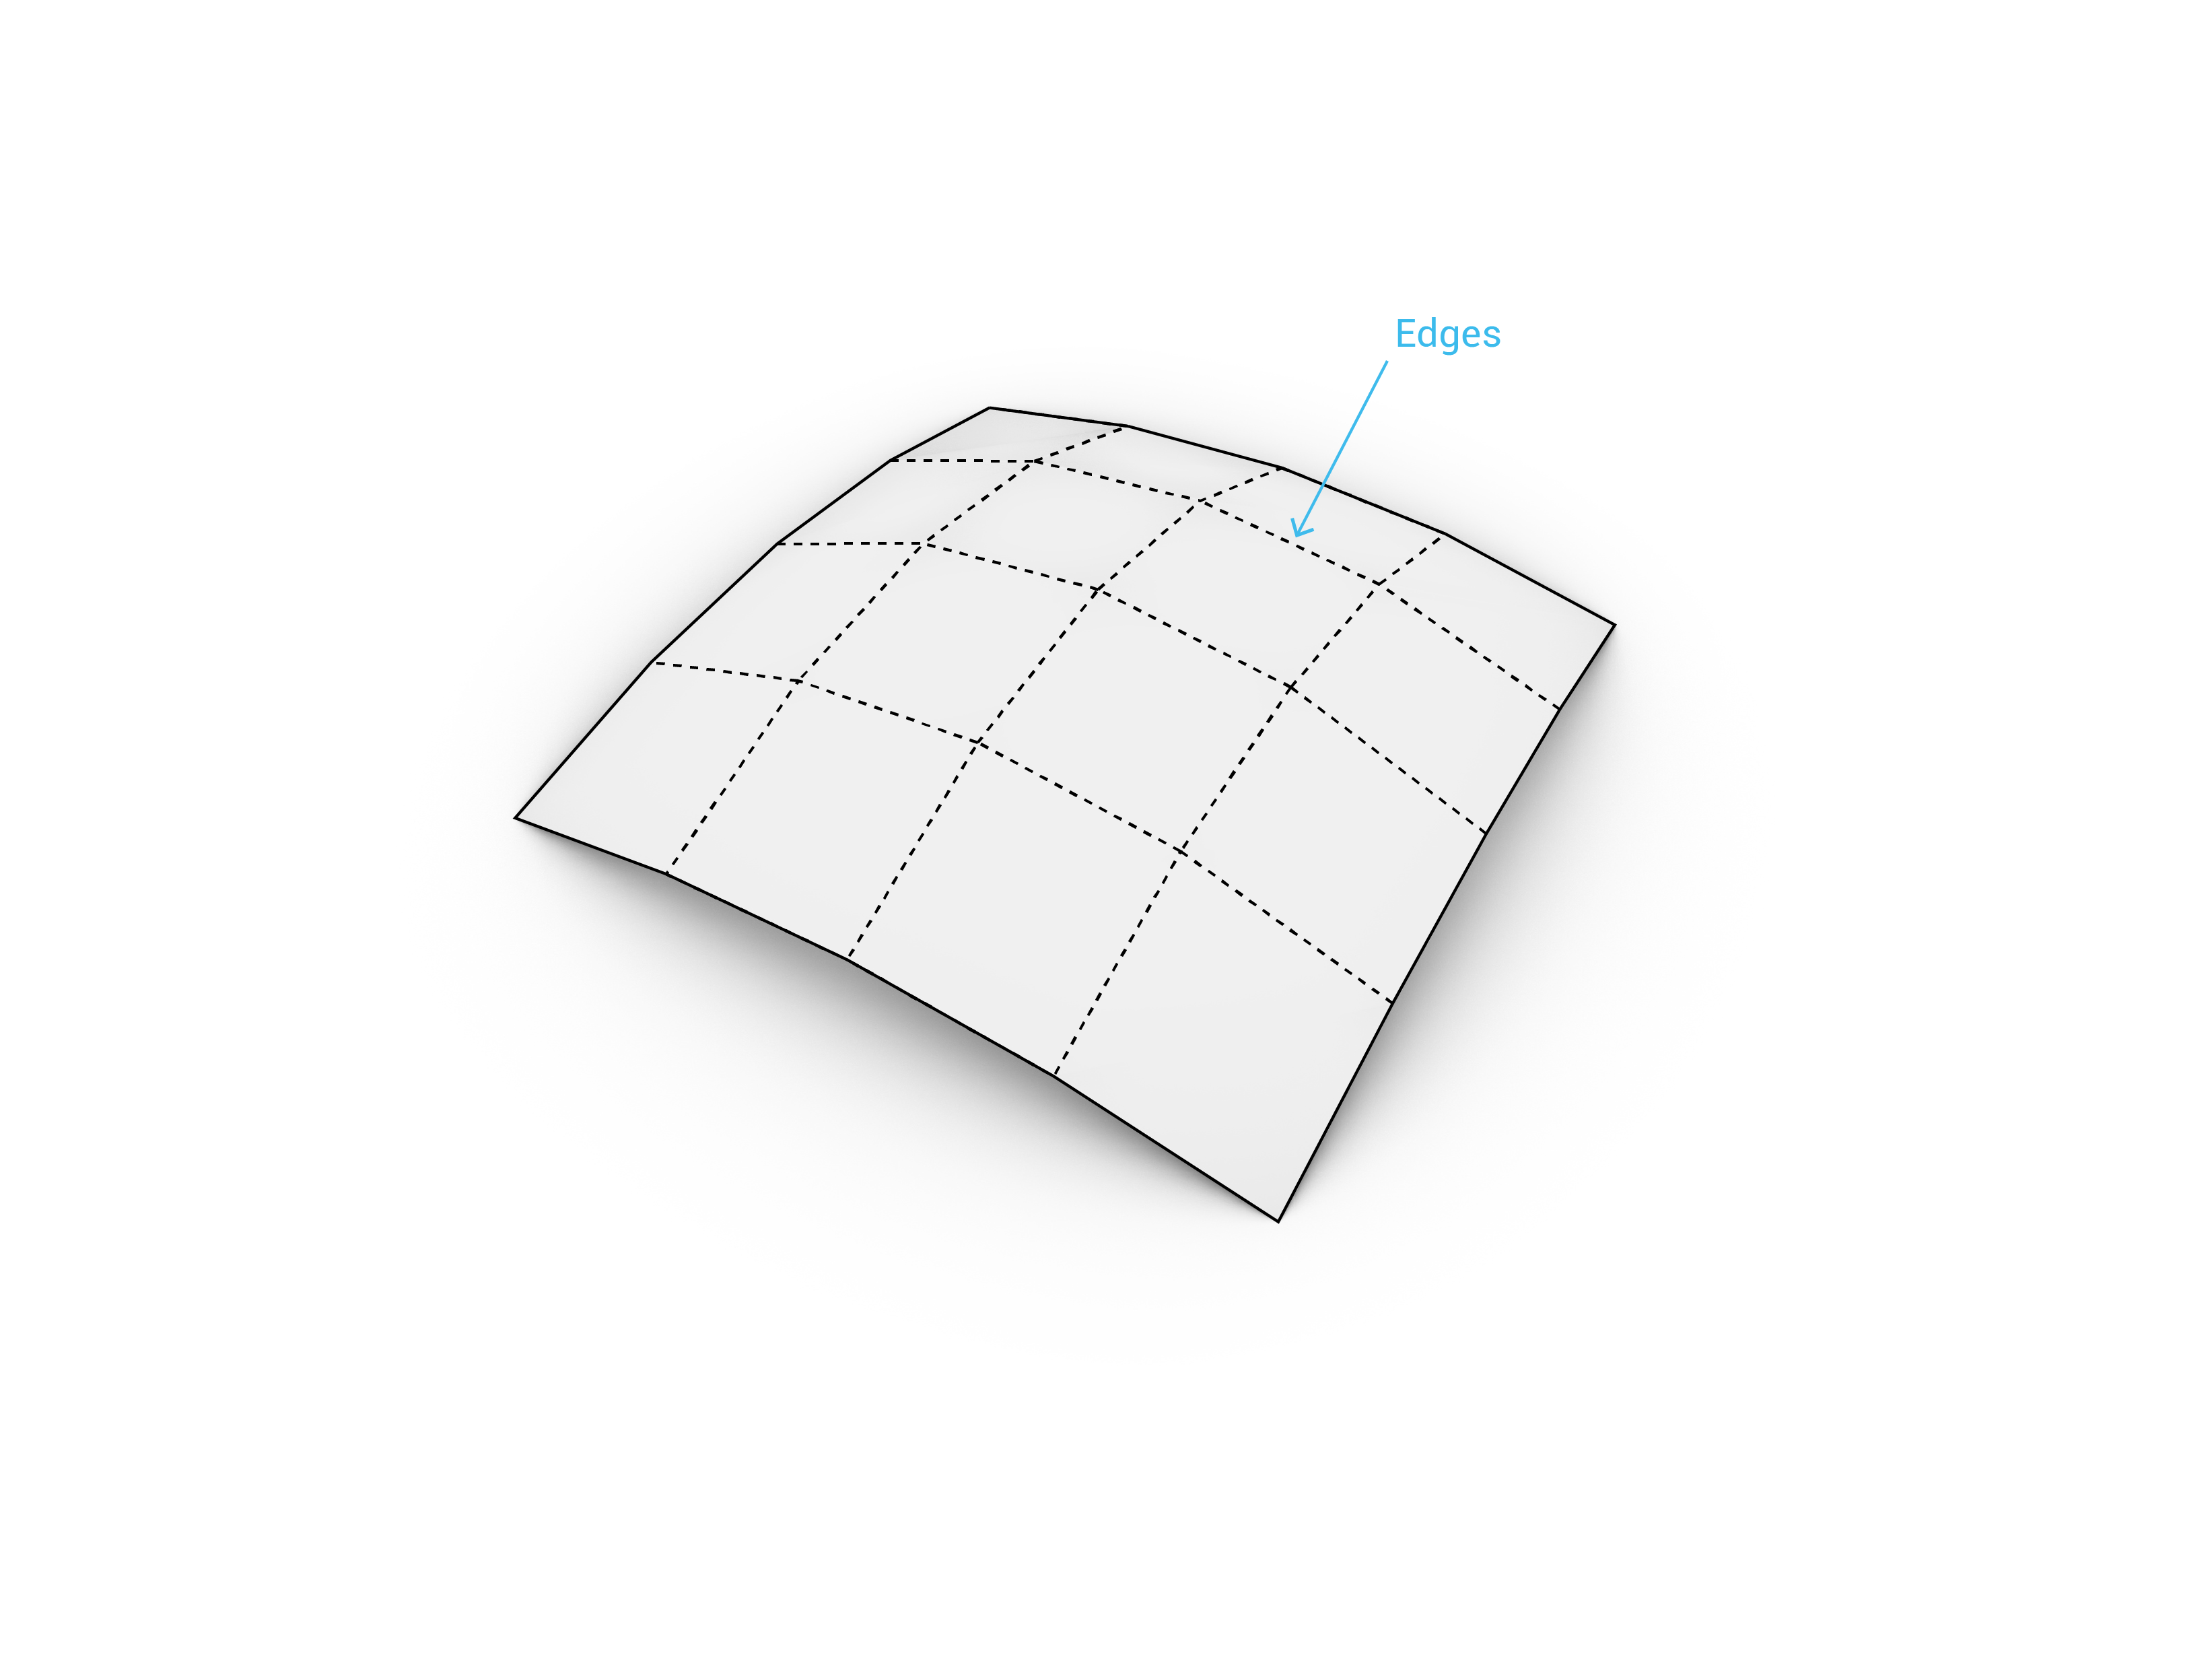
The points of a mesh are called vertices. Vertices are interconnected with edges.
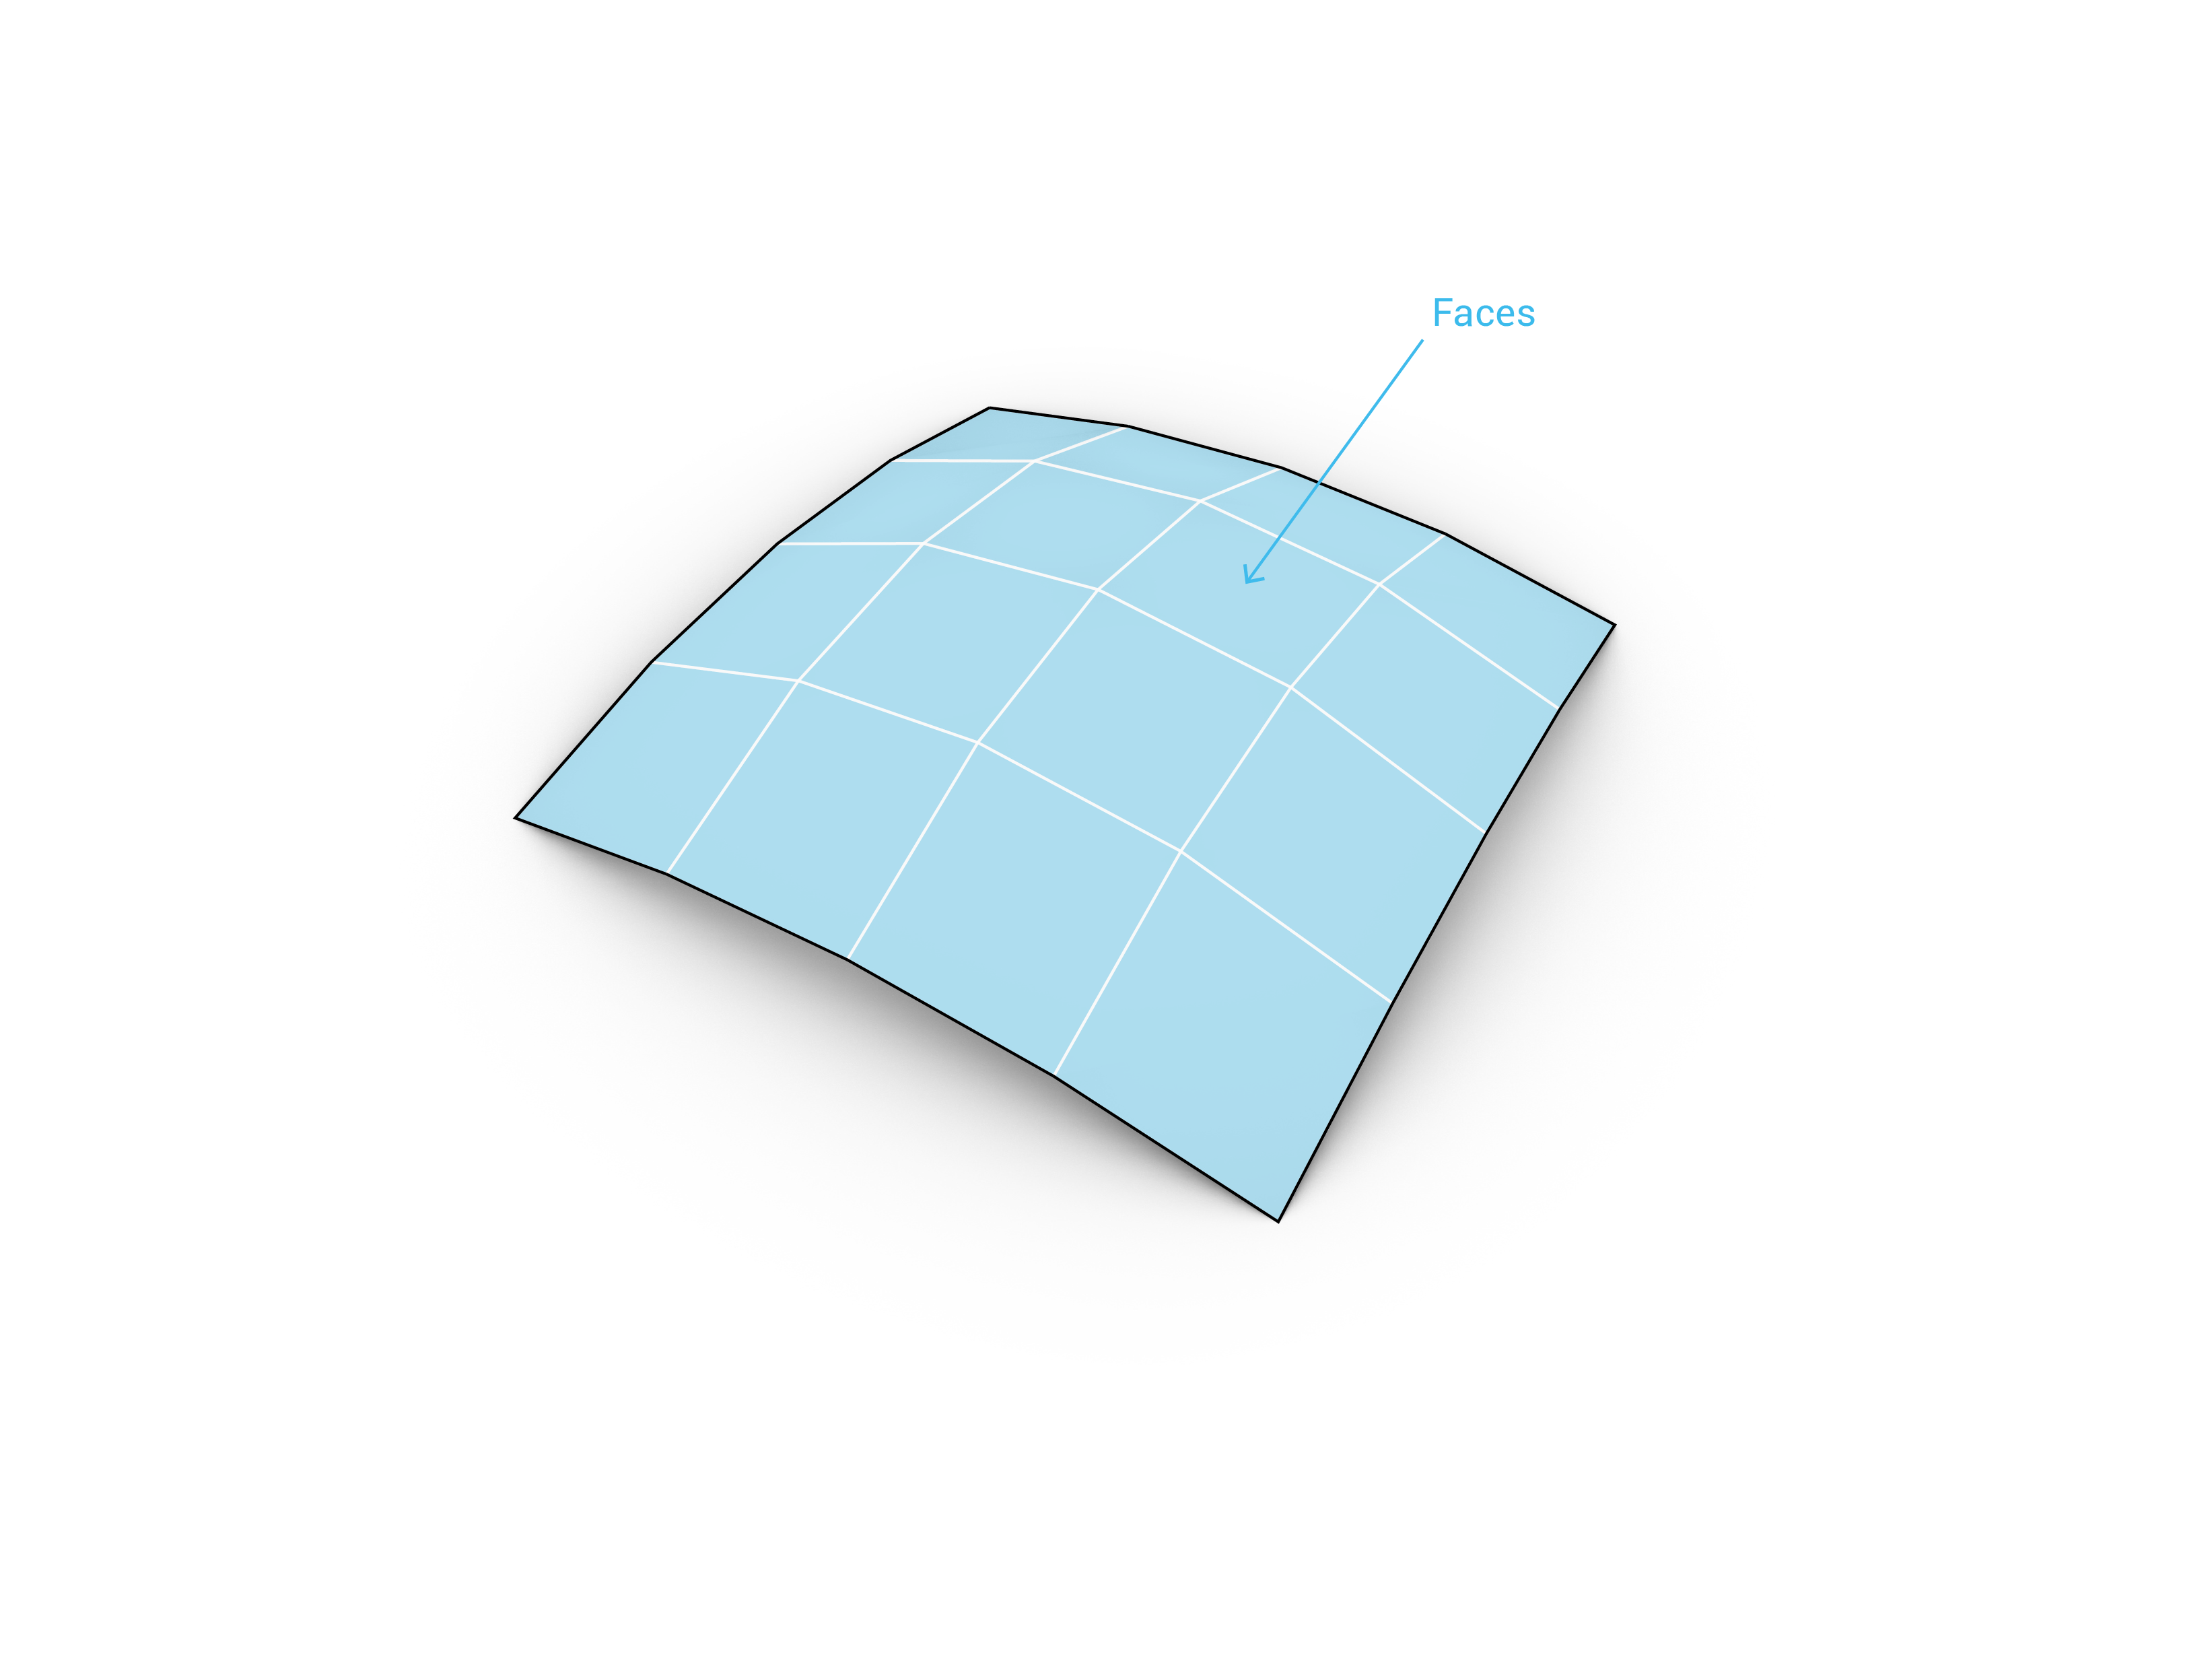
The polygons are called faces. To create a mesh we need a list of vertices and a system of grouping those vertices into faces.
Vertices
Is a list of points.
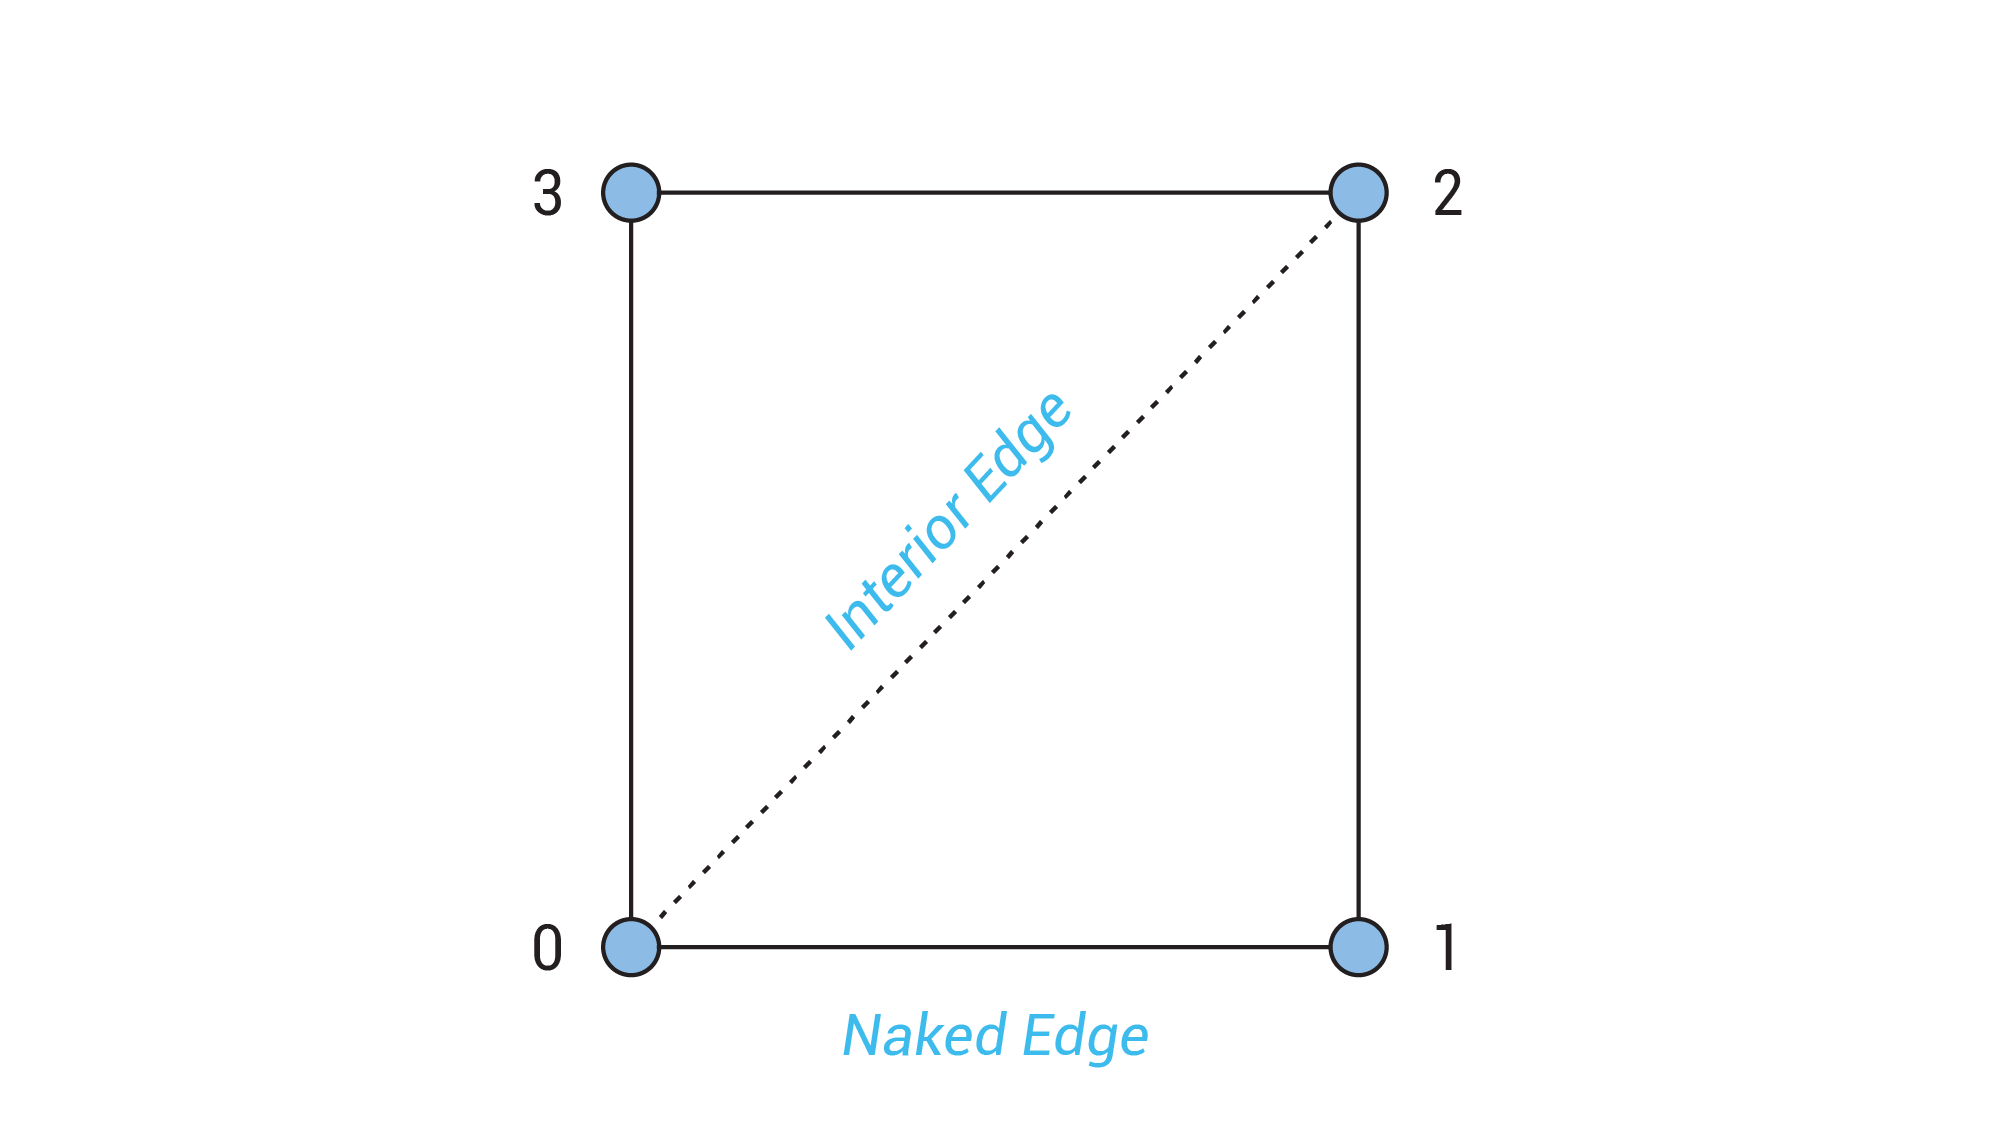
Faces
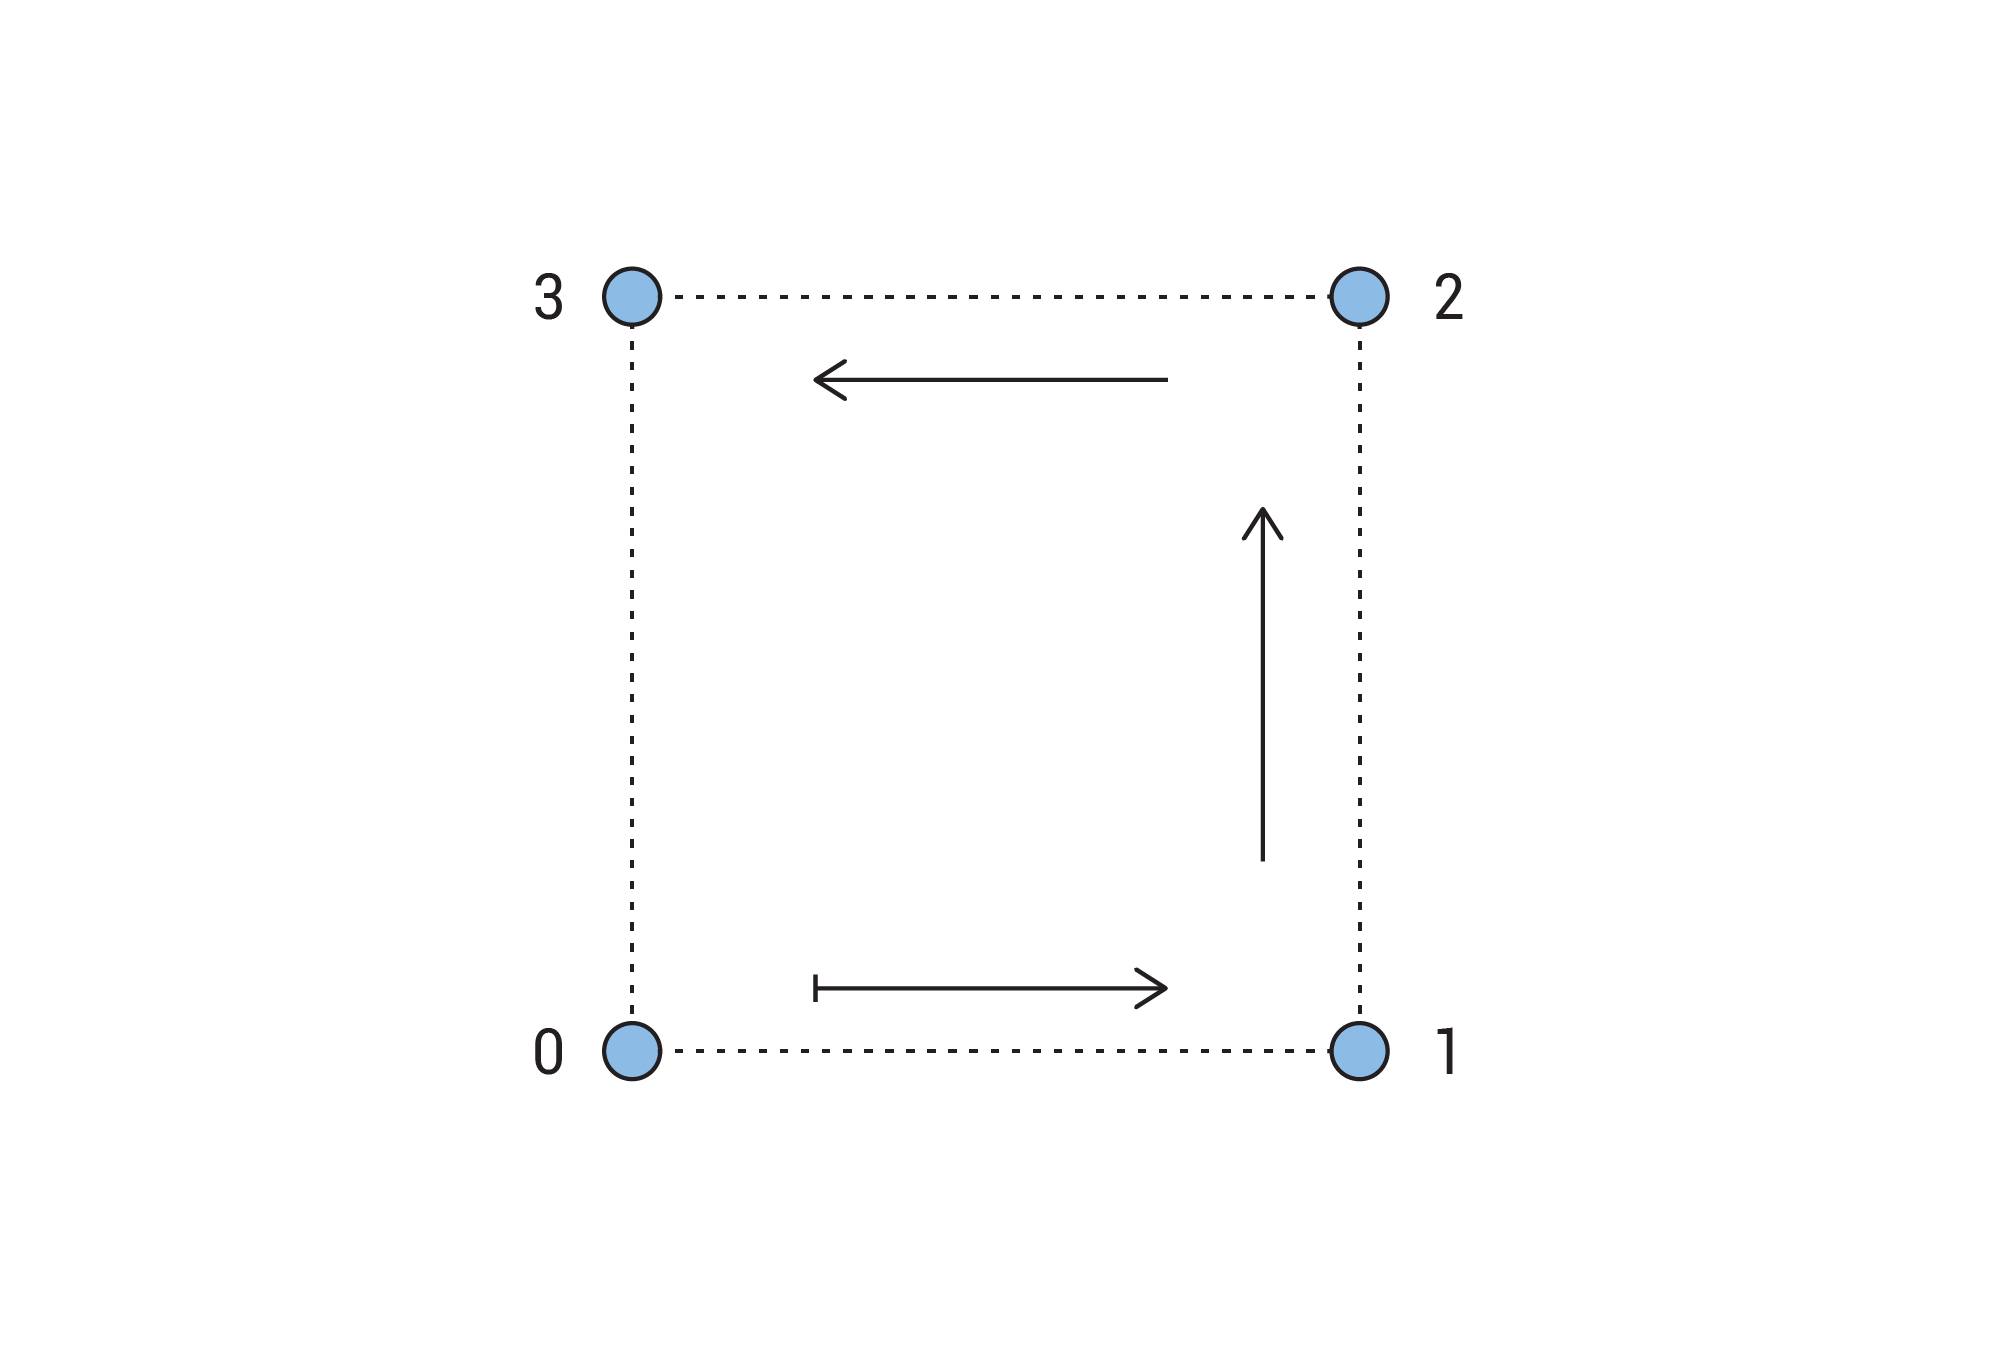
Is an ordered list of three or four vertices.
![]() Important to pay attention to the order of the indices when constructing a mesh face.
Important to pay attention to the order of the indices when constructing a mesh face.
Edges
Lines connecting any two consecutive vertices in a face.